Visualize Your Data in a Whole New Light
12 Ways to Examine Your Data Like Never Before
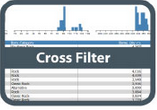
We have unveiled 12 useful visualizations that can be downloaded and plugged into the Pentaho platform - enabling users to make decisions even faster. If you are interested in learning how to create your own visualization plugins, please visit the Pentaho InfoCenter for details.
Visualizations
| HTML Table |
|---|
| border | 0 |
|---|
| cellpadding | 0 |
|---|
| rules | none |
|---|
| cellspaceing | 0 |
|---|
| frame | void |
|---|
|
| Table Row (tr) |
|---|
| Table Cell (td) |
|---|
| 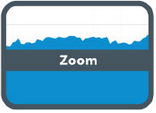 Image Modified Image Modified
Zoom |
|
|
| Info |
|---|
Disclaimer: These visualizations are provided for demonstration purposes ONLY. They are provided with no warranty or commitments regarding the quality of the sample and/or platform support. Many of the underlying charting libraries used in these samples only work on a subset of browsers that are part of Pentaho's official support matrix. |