Treemap
Treemap
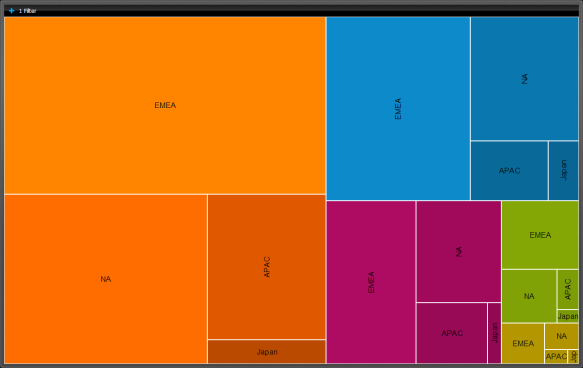 |
Sales by Territory color coded by Product Line |
A Treemap displays hierarchical information in a series of clustered rectangles, which together represent a whole. The size of each box represents a quantity. Treemaps also can use color to represent any number of values, but it is often used to categorize the various boxes within the treemap.
Get Started
Step 1: Download the plugin
- 12 Days visualization pack for Pentaho Business Analytics 5.4 - contains all 12 visualizations in a single plugin
- 12 Days visualization pack for Pentaho Business Analytics 5.1 up to 5.3 - contains all 12 visualizations in a single plugin
- 12 Days visualization pack for Pentaho Business Analytics 5.0 - contains all 12 visualizations in a single plugin
- Treemap chart plugin for Pentaho Business Analytics 4.8
Step 2: Follow the simple instructions for adding the plugin to your existing Pentaho BA Server
Step 3: Get Creative - explore your data, build cool stuff, amaze your friends and co-workers!
Disclaimer:
These visualizations are provided for demonstration purposes ONLY. They are provided with no warranty or commitments regarding the quality of the sample and/or platform support. Many of the underlying charting libraries used in these samples only work on a subset of browsers that are part of Pentaho's official support matrix.
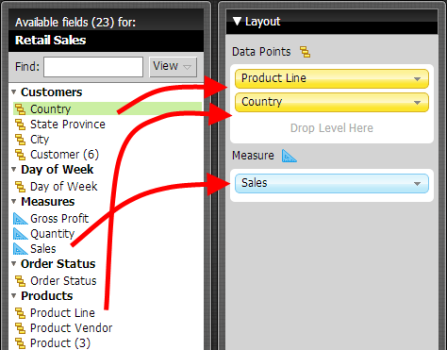
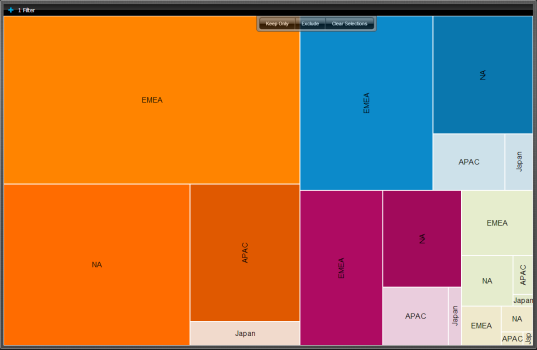
Working With Treemaps
 |
 | |
|
|
Tell Us What You Think
We're having lots of fun experimenting with various emerging visualization technologies and we would love to get your feedback. Here are a couple of ways you can share:
- Update the Treemap enhancement ticket
- Post feedback about additional ideas for improvements
- Get out and vote! All of the visualizations we are sharing are prototypes which we can consider for inclusion in future GA releases of the Pentaho suite. Voting for an enhancement is a great way to influence the priority in which we 'product-ize' these visualizations
- Tweet about it - got feedback or a cool example you've created and want to share? Tweet your comments or screenshots to #12DaysOfViz
Known Limitations
- Update 12/20/12 - posted a new build of the TreeMap plugin today at 3:30ET to resolve an issue where the Keep Only menu was not appearing as you make selections on the TreeMap. Note: any reports created with the older build of the TreeMap plugin will not work properly with the Keep Only menu, you will need to create new reports after updating to the latest plugin.