Tag Cloud
Tag Cloud
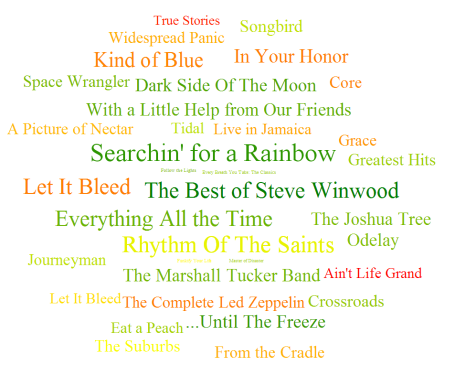 |
Song Sales Sized by Revenue and colored by Downloads |
Tag Clouds are a visual representation for text data, typically used to depict keyword metadata (tags) on websites, or to visualize free form text. Tags are usually single words, and the importance of each tag is shown with font size and/or color. This format is useful for quickly perceiving the most prominent terms and for locating a term alphabetically to determine its relative prominence.
Get Started
Step 1: Download the plugin
- 12 Days visualization pack for Pentaho Business Analytics 5.4 - contains all 12 visualizations in a single plugin
- 12 Days visualization pack for Pentaho Business Analytics 5.1 up to 5.3 - contains all 12 visualizations in a single plugin
- 12 Days visualization pack for Pentaho Business Analytics 5.0 - contains all 12 visualizations in a single plugin
- Tag Cloud chart plugin for Pentaho Business Analytics 4.8
Step 2: Follow the simple instructions for adding the plugin to your existing Pentaho BA Server
Step 3: Get Creative - explore your data, build cool stuff, amaze your friends and co-workers!
Disclaimer:
These visualizations are provided for demonstration purposes ONLY. They are provided with no warranty or commitments regarding the quality of the sample and/or platform support. Many of the underlying charting libraries used in these samples only work on a subset of browsers that are part of Pentaho's official support matrix.
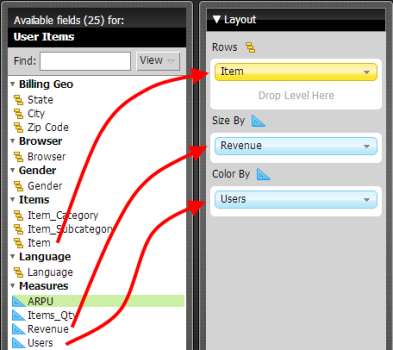
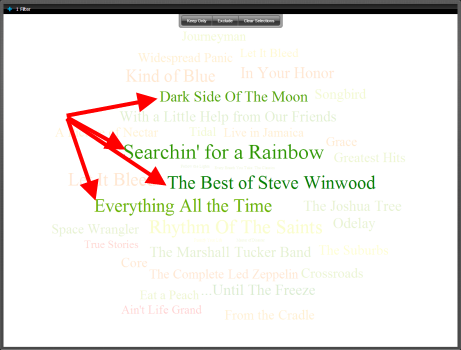
Working With Tag Clouds
 |
 | |
|
|
Tell Us What You Think
We're having lots of fun experimenting with various emerging visualization technologies and we would love to get your feedback. Here are a couple of ways you can share:
- Update the Tag Cloud enhancement ticket
- Post feedback about additional ideas for improvements
- Get out and vote! All of the visualizations we are sharing are prototypes which we can consider for inclusion in future GA releases of the Pentaho suite. Voting for an enhancement is a great way to influence the priority in which we 'product-ize' these visualizations
- Tweet about it - got feedback or a cool example you've created and want to share? Tweet your comments or screenshots to #12DaysOfViz
Known Limitations
- There is a small defect which will sometimes cause certain members being plotted to flicker (they are swapping positions with other tags on the display)