XYZSeriesCollectorFunction
Description
This collector builds a dataset that is compatible with JFreeChart XYZ charts that have three numeric dimensions or columns. XYZ datasets have four dimensions or columns. The first column is the series values. The next is the domain numeric column (typically the x-axis values or domain values), and the third column has the numeric values to be plotted on the y-axis, commonly referred to as the range axis. The fourth column determines a relative size value for the points plotted by the domain and range values.
Currently, only bubble charts support this collector function, so the third numeric column determines the size of the bubble for each point plotted.
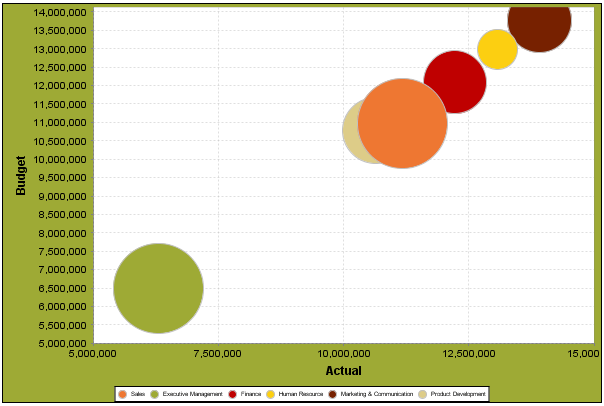
Chart Types That Work With the XYZSeriesCollectorFunction
The following chart types accept this type of collector:
- Bubble (BubbleChartExpression)
XYZSeriesCollectorFunction Properties
Property Name |
Data Type |
Description |
|---|---|---|
xValueColumn |
Array of Strings |
This is a zero-based array containing the name of the column(s) containing the numeric domain values. By zero-based, we mean that the first element in the array is element zero, not element 1. |
yValueColumn |
Array of Strings |
This is a zero-based array containing the name of the column(s) containing the numeric range values. |
zValueColumn |
Array of Strings |
This is a zero-based array containing the name of the column(s) containing the relative size values. |
seriesName |
Array of Strings |
This is a zero-based array containing the series name that appears on the chart. |
seriesColumn |
Boolean, true or false |
seriesColumn tells the engine that instead of specifying the individual series in the seriesName array, get the series names from the values in a particular column in the dataset. When seriesColumn is true, the seriesName element should specify the column name from which you want to retrieve the series names. |
group (optional) |
String |
This provides the name of the group that the chart is appearing in. If the chart is for detail information, then this is not necessary. This is used only in conjunction with summaryOnly (see below). When group is specified, then the data will only be gathered when the group is finished in the report (groupFinished event). When the specified group is finished, and when summaryOnly is true, then the data values are gathered from the valueColumn. So, this assumes that the grouping is on the series column. |
summaryOnly |
Boolean (true or false only) |
If summaryOnly is true, then when the items advance, no action is taken to accumulate data. This should only be used with a group specified so that when the groups advance, the data can be properly accumulated. |
resetGroup (optional) |
String |
The resetGroup specifies a group that will be used to create charts within a sub-group. For example, if charting one chart per region, and the chart is displaying data for departments within a region, the resetGroup would be set to the region group, and the chart group would be set to department group. For an example, see the Report Charting examples in the Pentaho Preconfigured Installation (demo). |