CategorySetCollectorFunction
Description
To generate categorical charts using JFreeChart, we need to create a JFreeChart dataset of type DefaultCategoryDataset. A categorical dataset is a three-dimensional (three column) dataset. The first dimension is the category column which defines the columns that contain the category names. The category can be considered a grouping of the bars (for example). The next dimension is the series. In bar charts for example, you'll have one bar for each series. Finally, the numerical value being plotted is the third dimension.
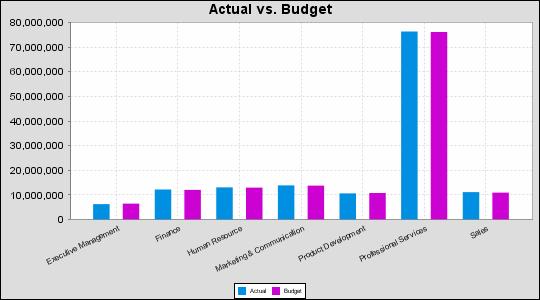
So, on the above bar chart, Executive Management, Finance, etc. are in the supplied category column (department). The first series name is Actual, and the second series name is Budget.
Chart types that work with CategorySetCollectorFunction
There are five chart types that work with Categorical datasets. The Area Chart (AreaChartExpression), the Bar Chart (BarChartExpression), the Line Chart (LineChartExpression), the Multi-pie chart (MultiPieChartExpression), and the Waterfall Chart (WaterfallChartExpression). For details on what each of these charts look like, please see the JFreeChart web site.
CategorySetCollectorFunction Properties
Property Name |
Data Type |
Description |
|---|---|---|
categoryColumn |
String |
The name of the column containing category names. See above for explanation of category columns. |
seriesName |
Array of Strings |
This is a zero-based array containing the series name that appears on the chart. By zero-based, we mean that the first element in the array is element zero, not element 1. |
valueColumn |
Array of Strings |
This is a zero-based array contain the data column names that correspond with the seriesName array above. For each valueColumn array element, you need to have a corresponding seriesName (see above). |
group (optional) |
String |
This provides the name of the group that the chart is appearing in. If the chart is for detail information, then this is not necessary. This is used in only in conjunction with summaryOnly (see below). When group is specified, then the data will only be gathered when the group is finished in the report (groupFinished event). When the specified group is finished, and when summaryOnly is true, then the data values are gathered from the seriesColumn and valueColumn. So, this assumes that the grouping is on the seriesColumn. |
summaryOnly |
Boolean (true or false only) |
If summaryOnly is true, then when the items advance, no action is taken to accumulate data. This should only be used with a group specified so that when the groups advance, the data can be properly accumulated. |
resetGroup (optional) |
String |
The resetGroup specifies a group that will be used to create charts within a sub-group. For example, if charting one chart per region, and the chart is displaying data for departments within a region, the resetGroup would be set to the region group, and the chart group would be set to department group. For an example, see the JFreeReport_Chart_Pie.xml. |