PivotCategorySetCollectorFunction
Description
This collector is also used with JFreechart categorical charts, as is the CategorySetCollectorFunction collector. The PivotCategorySetCollectorFunction actually extends the CategorySetCollectorFunction. This collector differs in that it will pivot the data to use a column of values as series, rather than individual columns themselves.
So, at a minimum, you will need a column from which the collector will retrieve the series names, and any number of numeric data columns after that that will serve as categories. The data values to be plotted for each series are the category columns' values.
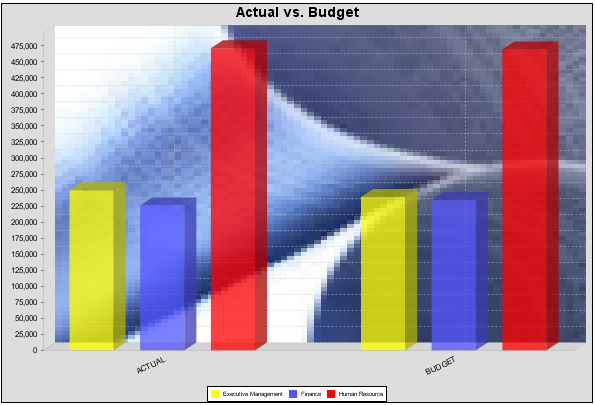
So, on the above bar chart, Executive Management, Finance, and Human Resources are the series, values taken from the series column DEPARTMENT. The categories Actual and Budget supply row based data points for each series.
Chart types that work with PivotCategorySetCollectorFunction
There are five chart types that work with Categorical datasets. The Area Chart (AreaChartExpression), the Bar Chart (BarChartExpression), the Line Chart (LineChartExpression), the Multi-pie chart (MultiPieChartExpression), and the Waterfall Chart (WaterfallChartExpression). For details on what each of these charts look like, please see the JFreeChart web site.
PivotCategorySetCollectorFunction Properties
Property Name |
Data Type |
Description |
|---|---|---|
seriesColumnHeader |
String |
The name of the column containing the series names. |
seriesName |
Array of Strings |
This is a zero-based array containing the series name that appears on the chart. By zero-based, we mean that the first element in the array is element zero, not element 1. These series names will exist as data values in the seriesColumnHeader. |
categoryName |
Array of Strings |
This is a zero-based array containing the category name that appears on the chart. By zero-based, we mean that the first element in the array is element zero, not element 1. These category names will exist as column names in the dataset. |
group (optional) |
String |
This provides the name of the group that the chart is appearing in. If the chart is for detail information, then this is not necessary. This is used in only in conjunction with summaryOnly (see below). When group is specified, then the data will only be gathered when the group is finished in the report (groupFinished event). When the specified group is finished, and when summaryOnly is true, then the data values are gathered from the series column. So, this assumes that the grouping is on the series column. |
summaryOnly |
Boolean (true or false only) |
If summaryOnly is true, then when the items advance, no action is taken to accumulate data. This should only be used with a group specified so that when the groups advance, the data can be properly accumulated. |
resetGroup (optional) |
String |
The resetGroup specifies a group that will be used to create charts within a sub-group. For example, if charting one chart per region, and the chart is displaying data for departments within a region, the resetGroup would be set to the region group, and the chart group would be set to department group. For an example, see the JFreeReport_Chart_Pie.xml. |