1. Quick Start
This section contains instructions for creating a report and and an overview of basic Report Designer features. See Report Design Wizard to create a report using Report Designer quickly and easily.
Important: The Report Designer interface has changed. Report Designer documentation has been updated to reflect recent changes.
The latest distribution for Report Designer is available on SourceForge at http://sourceforge.net/project/showfiles.php?group_id=140317. Download the Report Designer as part of the Pentaho Open BI Suite (pentaho_demo_hsqldb-1.6.0.GA.863.zip), if you plan to publish your reports using the BI Platform provided by Pentaho. To download the Report Designer as a standalone application, go to http://sourceforge.net/project/showfiles.php?group_id=140317&package_id=192362. To follow the instructions and tutorials included in the Report Designer documentation, you must install the Hypersonic distribution of Sample Data (pentaho_sample_data-1.6.0.GA.863.zip).
System Requirements
- Windows XP Professional, Mac OSX 10.4.6, SUSE Linux 10.1, Red Hat Enterprise Linux 5.
Note: Other versions of the above-listed Linux distributions, and other distributions entirely, will probably work with Report Designer. However, the distros listed here are tested and supported by Pentaho.
- Requires the 1.5.0_06 Java Runtime Environment (JRE)
Installing Report Designer
After you download the contents follow the instructions below to install Report Designer (these instructions are for the standalone download):
- Extract contents of the zip file into a folder.
- Read the Readme for important updates.
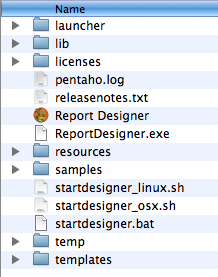
- In the Report Designer folder, click the file that is most appropriate for your operating system.
- Windows - ReportDesigner.exe
- Linux - startdesigner_linux.sh
- Mac OS X - Report Designer.app
The Pentaho Report Designer Version Checker
Pentaho Report Designer includes a version checker that prompts you when new versions of Report Designer are available. When performing a version check, the server makes an HTTP call to Pentaho Report Designer and exchanges information. This information is used to determine if an update is available and to analyze Report Designer usage in different environments. The version checker helps Pentaho to plan and prioritize platform certifications, testing plans, and localization plans.
Note: Version checker is available for all components of the Pentaho BI Platform.
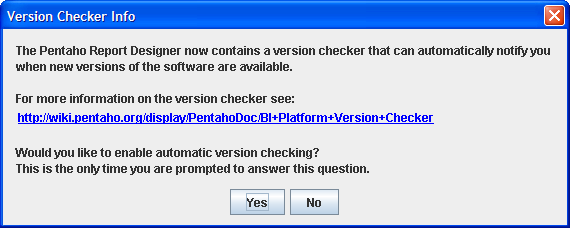
When you first install the Report Designer, the following dialog box appears prompting you to enable the version checker:
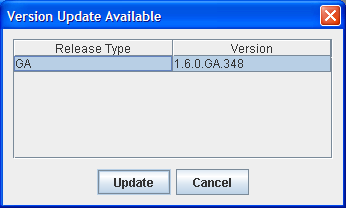
If you enable the version checker, you receive periodic update notices as shown below. These notices appear when there is a major General Availability (GA) release. Click the version you want, then click Update to begin downloading.
You can enable automatic version checker in Report Designer if you did not enable it during installation. Go to File -> Settings and click Enable Version Checker:
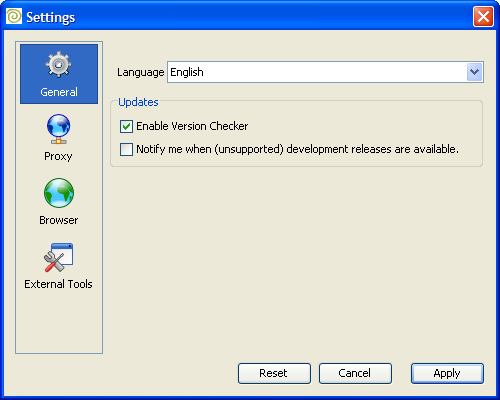
By enabling the Notify me when (unsupported) development releases are available option, you receive update notification when there are development releases. These too will be in the list of available downloads. Keep in mind, however, that unsupported development releases may not have the full functionality and features available in General Availability releases.
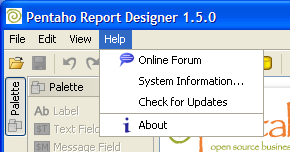
If you opt out of the version checker, you can still check for updates manually. In Report Designer, go to Help -> Check for Updates:
Disabling Automatic Version Checker
If you enabled automatic version checker when you installed Report Designer, you can disable it by following the instructions below:
- Go to USER_HOME/.Report
- Find the file workspaceSettings.xml.
- Find the element, <property name="useVersionChecker">false</property>.
- Change the property value from "true" to false.
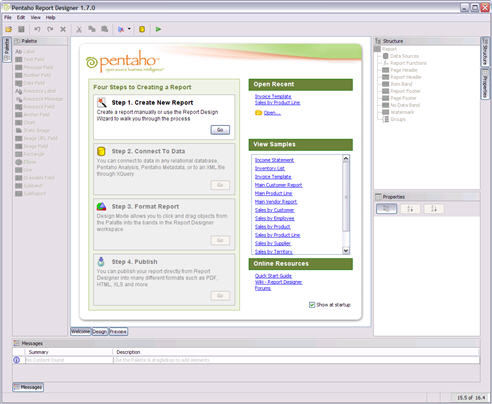
Report Designer Start Up
The Report Designer displays a Welcome page and a default workspace at start up. The Welcome page provides you with a brief introduction of the Report Designer and some instructions for getting started. The Welcome page also provides access to sample reports and recently opened reports. Click Design to open the report workspace.
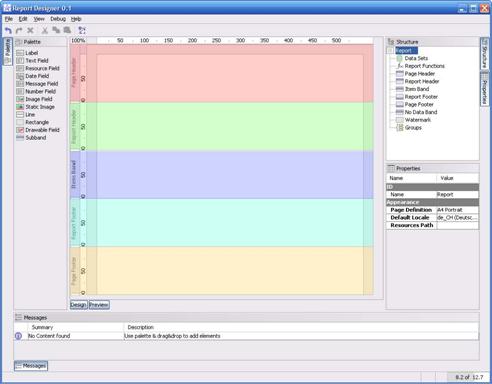
In the center of the workspace a large white area represents the main working area where you build a report. On the left side of the Report Designer workspace is the Palette that lists the graphical elements of the report. On the right side of the workspace, the Structure panel allows you to see a hierarchical representation of the report. The Properties panel allows you to adjust the settings of the currently available selection. In the lower portion of the workspace, the Messages panel displays useful information, hints, warnings, and errors that apply to your current report definition.
The Data Model
Warning: Reports created with WAQR will not properly open in Pentaho Report Designer because of an XML syntax error. WAQR creates reports with <cdata> tags around each line, but Report Designer is expecting only one <cdata> tag around the entire file. If you want to open a WAQR-created report in Report Designer, you will have to edit the .xaction file by hand using a text or XML editor and remove all of the superfluous <cdata> tags, leaving only one tag around the entire file.
A report generally consists of data supplied by a database in the form of a table and a report definition that defines how the report must be formatted or printed.
Table 1.1. Sample Data FIRST_NAME (String) |
LAST_NAME (String) |
PRODUCT_NAME (String) |
PRICE (Number) |
|---|---|---|---|
Erik |
Brown |
Electra |
9.65 |
Erik |
Brown |
Harry Potter |
6.95 |
Erik |
Brown |
Electra |
9.65 |
Hans |
Meiser |
Electra |
9.65 |
Hans |
Meiser |
Martix |
15.98 |
Hans |
Meiser |
Mogli |
23.98 |
The columns can by identified by an unique column name with a certain data type. In the sample above, FIRST_NAME is a column identifier and String is the data type of this column. For convenience, there is a database embedded in the Report Designer that contains some useful data with which to test.
Adding the Sample Data Source
Follow the instructions below to configure a sample data source. See Data Sources for additional information about the different types of data sources.
- In the Structure panel, right-click Data Sources and select Add Data Source (formerly Add Pentaho Dataset). A window opens where you can configure the query used in the data source.
- Select SampleData and click the Query Designer. Make sure your Hypersonic database is running before doing so.
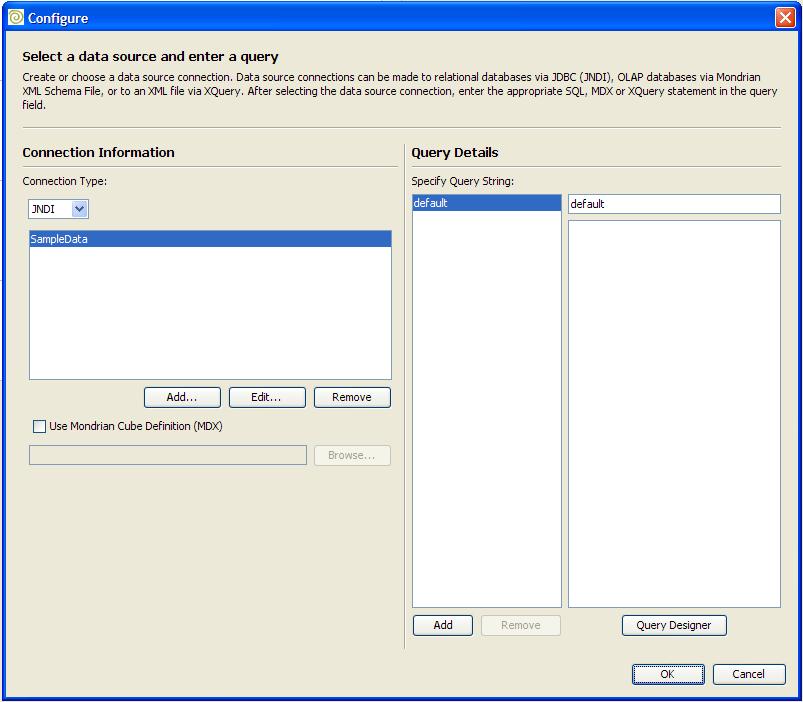
- Select PUBLIC from the Choose Schema list box. The SQLeonardo window is loaded. From this window, you can select the tables/views to be included in the data source.
- Select the PRODUCTS table by clicking PREVIEW. This allows you to visualize the data in the table quickly.
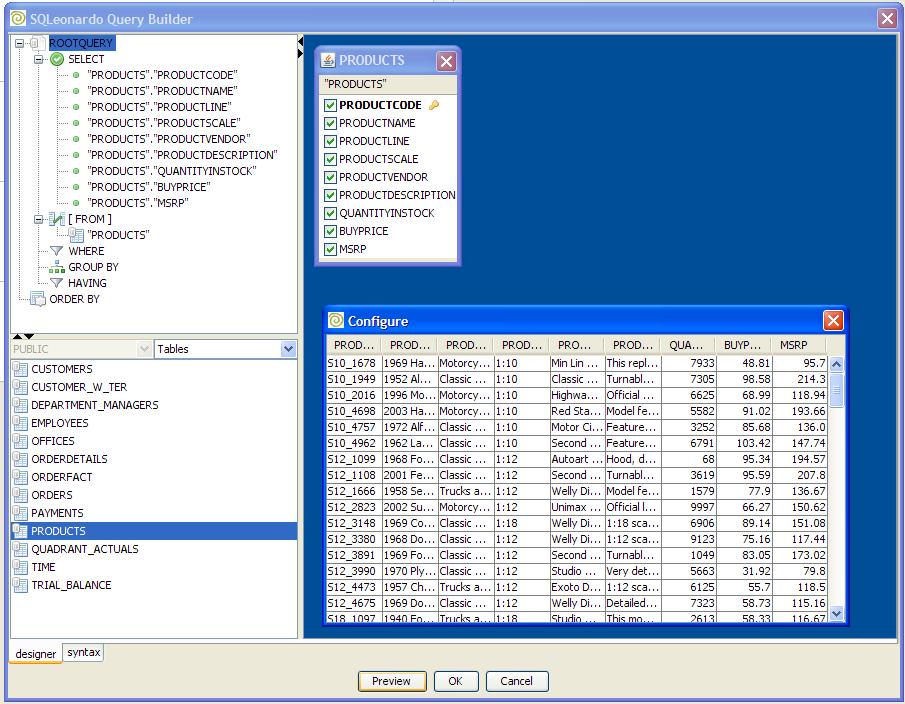
- Click OK to close both windows.
The data source is added to the report. The Properties tool window displays the available columns and the data type of each column. Click Configure to change the configuration of a data source. The data source is now set up and installed correctly. You must now define the look of the report.
The Report Definition
The report definition is what you compose in the main area of the graphical Report Designer. This definition provides the reporting engine with the location of each field on the report. The report definition consist of several sections called bands, such bands may include a report header, a page header, the item band and others.
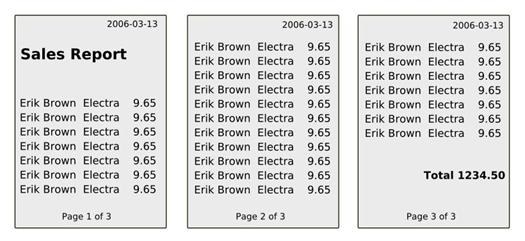
The following image represents a schematic report as it may appear on the page:
The standard bands available in all reports are marked with different colors in the following image.
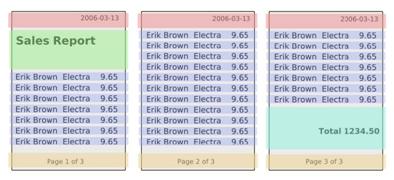
Red: the page header band. This band is usually printed at the top of each page
Green: the report header band. This band is printed once when the report starts
Blue: the item band. This band is printed for each row available in the data table
Turquoise: the report footer band. This band is printed once at the end of the report
Orange: the page footer band. This band is printed once at the bottom of each page
The same bands are marked with the same color in the Report Designer. Note that the bands have a label on the left side describing what this band is used for.
If you adjusted a band to be very small, it may be possible that you cannot read the descriptive label anymore. In this case, hover over the label and a tool tip displays the text.
There can also be multiple group header and group footer bands.
Creating the Report Definition
To start, we are going to add a static title label to our report that should be printed once on the first page of the report. We are going to add this label to the report header band. This label does not depend on the data delivered by our sample data source; therefore, it is also called a static label.
Click and drag the Label report element from the Palette tool window to the report header band.
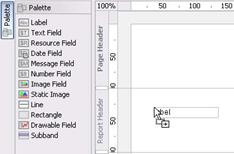
The label is automatically selected after it was added to the report header band. You can move the label around using the mouse or resize the label by dragging one of the handles.

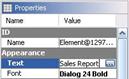
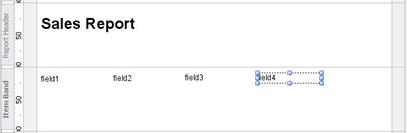
You can use the Properties tool window to adjust the text and font in use. Change the text to "Sales Report" and the font to "Dialog 24 Bold".
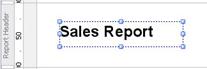
If you did not change the size of the label, a warning may appear in the Messages tool window stating that the label is not big enough to display the text. Resize the label until there is enough space for the label to print the contents.
The report header band should look like the one shown below.
Click Preview.

After you start the report engine, a preview displays that looks like final report, but is limited to a certain number of data rows you can configure in the data source. The booting process is only done once; subsequent invocations of the preview are almost instantaneous. Go back to the Design view by clicking Design.
Now, add text fields that contain data from the sample data source. Report elements that are dynamically filled with data have the suffix field.
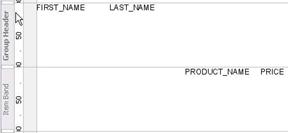
Drag and drop four Text Fields from the Palette to the item band as shown below:
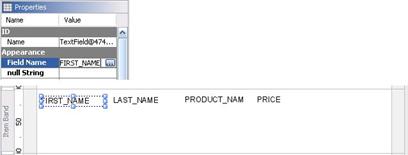
The Messages tool window displays several warnings about undefined fields. Each text field should display a column from our sample data source hence we need to set each text field's "Field Name" property in the Properties tool window to match a column from the data source.
Preview the report and customize the report definition by using different fonts, background colors, lines and additional static labels as you like.
The next segment contains instructions for creating the total sum of all sales by introducing functions.
Functions
A function is a custom program that can return a value depending on other values available in the report. A function can use values available in a data source or use the value returned by another function. This can be used to calculate a total sum, average, minimum, maximum or can be used to hide a label or to hide a rectangle in every second line. Functions can also collect values used to create charts or to format/convert a value from a data source into another data type. Functions are very flexible and make almost everything possible.
The next section demonstrates how to calculate the total sum of all sold items.
Adding the Total Sum
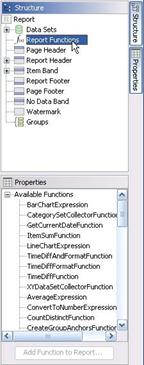
Functions can be added through the Structure panel by selecting the Reporting Functions node. All available functions are listed in the Properties tool window with a short description in a tool tip.
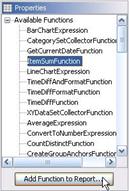
You want to calculate the sum of all price items in the report so select the ItemSumFunction and click Add Function to Report.
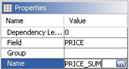
First the function must be able to identify a field you specify for which to calculate the sum. You must also set the name of the function. This is very important, because the value of the sum is accessible through this name. Note that an error is displayed in the messages tool window until you set the name. You cannot preview a report as long as an error message displays in this tool window.
Set PRICE as the Field used to calculate the sum; use PRICE_SUM as the name of the function. Don't change the values of the Dependency Level and the Group.
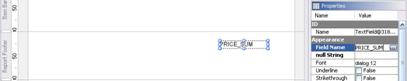
Now you have to display this value somewhere on the report. Add a Text Field to the report footer band and set the Field Name property of the Text Field to PRICE_SUM (the name of the function).
A preview of the report should look like the sample below:
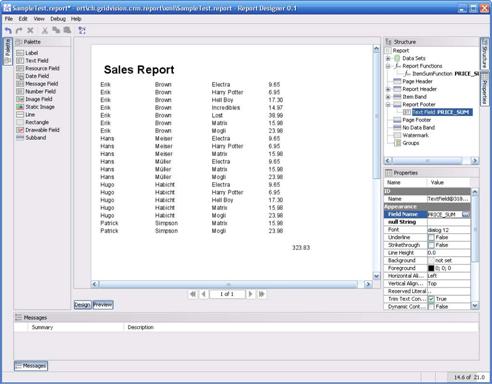
The sum is printed after the last item is printed. You can adjust the report definition as needed.
Report Groups
The structure of the report definition is all right, but you may want to merge the items for each customer and calculate the sum for each customer separately. This is called "grouping." The next segment demonstrates how to group the data by customer.
Adding the Customer Group
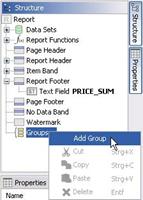
Groups can be added in the Structure tool window by selecting the Groups node and selecting Add Group.
A group merges or groups all consecutive items with the same values in a group. Each time a new group starts, the group header band of this group is printed. Whenever a group ends, the group footer band is printed.
When you take a look at the preview of the sample report, you want a group to start for the first item of "Erik Brown." The group complete after the last entry of "Erik Brown" and a new group should start for "Hans Meiser" and so on.
For this to occur, you must force the group to apply to the fields FIRST_NAME and LAST_NAME. (FIRST_NAME only won't be sufficient because there is a "Hans Meiser" and a "Hans Müller"); therefore, set Group Fields of the group as shown in the example below:
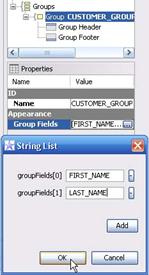
Always give a group a meaningful name. In this sample, use the name, CUSTOMER_GROUP.
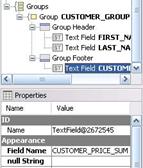
When you expand the group in the Structure tool window you can see that there is a group header band and a group footer band available. These bands do not yet appear in the graphical report definition area. To make them appear, select both bands in the Structure tool window and enable the Show In Layout GUI property:
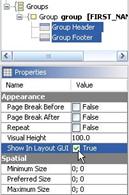
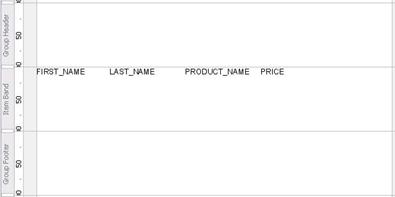
You can now see the the group header band above the item band and the group footer band below the item band. This is also the direction in which they are printed.
To effectively make the group take effect visually, move the FIRST_NAME and LAST_NAME Text Fields to the group header. To do this either delete the existing fields and create new ones in the group header or cut and paste them. You can achieve this by selecting both fields, either in the graphical view or in the Structure tool window, by pressing the <CTRL> and selecting the fields.
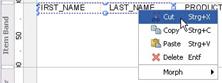
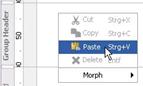
Now right-click in the group header band and select paste:
The bands should look like the sample below:
Adding the total sum for each group:
- Select the Report Functions node in the Structure tool window.
- Choose the ItemSumFunction and add it to the report.
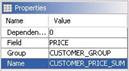
- Enter PRICE as the Field, CUSTOMER_GROUP as the group and CUSTOMER_PRICE_SUM as the function name
- Add a Text Field to the group footer band, and set the Field Name to CUSTOMER_PRICE_SUM.
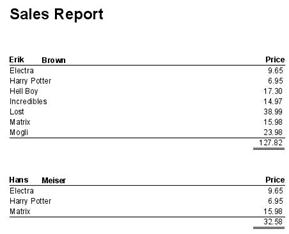
You now have a report that sums the total sales and calculates the total sum for each customer. You can now start to enhance the report definition as needed.
After some minor adjustments, additional labels, and a few lines here and there there, the resulting report looks as follows: