2. User Interface
This chapter describes all user interface elements of the Report Designer. While most functions and available actions are designed to be easy accessible and easy to understand, the Report Designer also includes advanced functions.
The Welcome Page and Main Window
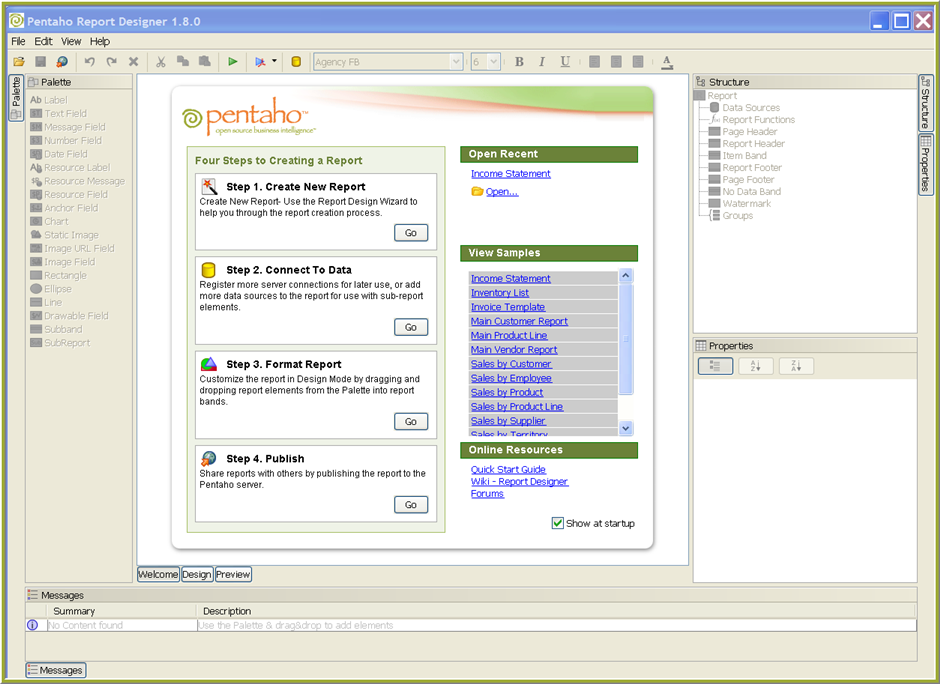
When you access the Report Designer for the first time, a Welcome page appears, which provides you with a quick overview of the steps you must take to create and publish a report. In addition, the Welcome page provides you with links to report samples and Report Designer documentation. Once you have created a report, the Report Designer Welcome page also displays links to recently created reports. You can bypass the Welcome page and go directly into the Report Designer workspace by clicking Design on the lower left corner of the page. Disable Show at startup if you do not want the Welcome page to display.
Menu Bar, Toolbar, and Commands
The menu bar consists of most commands you can invoke in the Report Designer. The following section provides a short overview of the main menu items available. Commands sometimes depend on the current state of the Report Designer, such as the current selection and the contents available in the clipboard. If not all required information is available for a command to be executed successfully, the command is either disabled or displays a message explaining why the command can not be used.
Toolbar
The toolbar now includes formatting commands that allow you to change the look of the text in labels, text fields, message fields, number fields, and so on. The formatting commands are also available in the Properties Editor.
Toolbar item |
Description |
|---|---|
|
Open File |
|
Save File |
|
Undo |
|
Publish |
|
Redo |
|
Delete |
|
Cut |
|
Copy |
|
Paste |
|
Create Report |
|
Select Font Type |
|
Select Font Size |
|
Apply Boldface |
|
Apply Italics |
|
Apply Underline |
|
Select Font Color |
|
Preview As (PDF, HTML, RTF, XLS, CSV) |
|
Add Data Source |


Main Menu
Menu item |
Description |
|---|---|
File |
Provides the basic file operations for loading/saving and exporting reports. The applications settings are also available in this menu. |
Edit |
Commands related to editing the currently open report. Most actions apply to the current selection. |
View |
Commands to change the current view like zooming, changing units, or activating the preview. This generally does not have any effect on the definition of the report. |
Help |
Provides commands to show information about the Report Designer such as the online help and links to tutorials. |
Report Definition Area
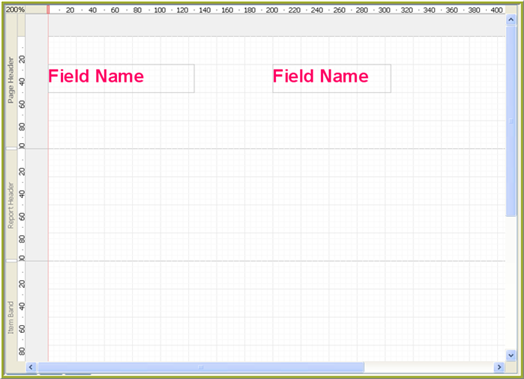
The report definition area is the Report Designer workspace. Use it to create and preview the report. The sample below displays one of the bands of the report definition area.
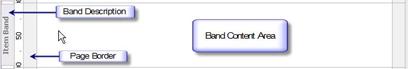
Clicking on the Band Description makes the band receive the input. Invoking commands like Select All or Paste are in the context of this band. The current selection is not changed by this action.
Clicking on the Page Border will select this band and makes the band receive the input.
Clicking on the Band Content Area will make the band receive the input and will possibly select elements under the cursor.
A band can be visually resized by dragging the mouse on the Band separator; this does not have any effect on the generated report.

Elements part of the band can be selected by clicking the mouse on this element. If there are multiple overlapping elements under the cursor, click the same spot repeatedly, and the selection will cycle through the possible elements. You can select multiple elements by holding down the <CTRL> key.

Lassoing makes it easy to select multiple objects for copying, cutting, pasting, and so on. Click and drag the mouse to create a rectangular selection area around the objects you want to activate.
Double-clicking a text element starts the inline editing mode. You can directly type in text like in a usual text field. You can leave this inline editing mode by pressing Enter and accepting the changes you made or by pressing <Esc> and undoing the changes you made. Clicking outside the element also cancels the inline editing mode and does not accept your changes.
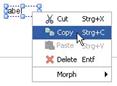
Right -click to display a pop-up menu for the most common commands like copy and paste.
Using Snap-to-Grid
You can fine tune the placement of report elements by using the Report Designer snap-to-grid feature. When you draw, resize, or move a report element, it aligns or "snaps to" the closest intersection of lines in the grid. Element frames ensure that you do not overlap one report element over another. The snap-to-grid feature allows you auto-align report elements so that they are accurately placed in your report. Go to View > Toggle Snap-to-Grid, to disable or enable snap-to-grid.
Using Paste Formatting Command
The Paste Formatting command copies the formatting (font type, color, boldface, and more) from text elements on your workspace and applies it to other text elements. Follow the steps below to use the Paste Properties command:
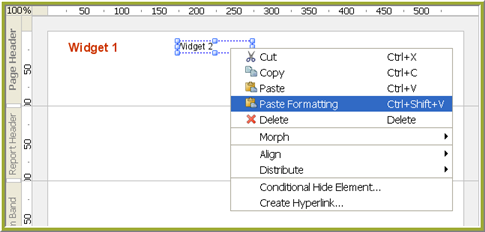
- Select an element in your workspace that contains the formatting you want to apply.
- Press <CTRL>+ C to copy the formatting. (Alternatively, you can select the Copy command from the Edit or right-click menu).
- Select the element on your workspace where you would like to apply the formatting, right-click, and select Paste Formatting or press <CTRL>+<SHIFT>+V. Report Designer applies the formatting to your element. You can use the same procedure to apply formatting to multiple elements.
Tool windows
A Tool window is a part of the interface that groups together related control elements. There are four built in tool windows available in the Report Designer.
Palette Tool window
Structure Tool window
Properties Tool window
Messages Tool window
Tool windows can be resized with the mouse and can be completely hidden by pressing the Tool window control button. By clicking the right mouse button on the tool window control button you can move the Tool window to another side of the screen.

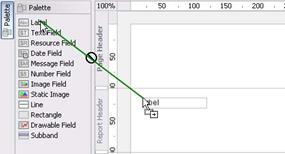
Palette Tool window
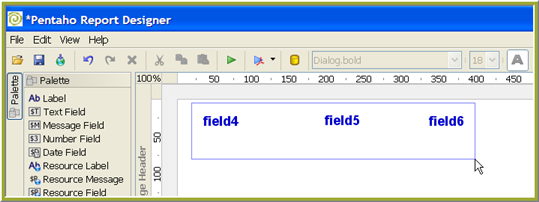
The Palette tool window stores all graphical report elements available to be added to a report. You can drag and drop elements from the palette to one of the bands available in the report definition area by pressing the mouse button on an element in the palette and dragging the mouse to the band and releasing the mouse button:
Structure Tool window
The Structure tool window shows all visual and non visual report elements added to a report:
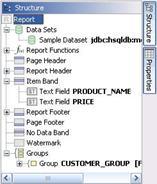
Report Under this node are all report elements, visual and non-visual, currently available in the report.
Data Sets Under this node are all datasets listed currently added to the report.
Report Functions All functions that are available in the report.
Page Header All visual elements added to the page header band .
Report Header All visual elements added to the report header band .
Item Band All visual elements added to the item band .
Report Footer All visual elements added to the report footer band .
Page Footer All visual elements added to the page footer band .
No Data Band All visual elements added to the no data band .
Watermark All visual elements added to the watermark band .
Groups All groups with their subgroups and visual elements.
All these listed report elements are mandatory and can only occur once in a report definition. Therefore these elements can not be deleted, and can not be part of a cut/copy/paste command.
Each node in the Structure tool window has an individual pop-up menu. The Data Sets node has special entries to add additional datasets. The Groups node has a special pop up menu to add additional groups to the report. All entries in the pop-up menu are enabled or disabled depending on the current selection or clipboard content.
The Structure Tool window can also be used to select multiple elements from the same or from different bands. Keep the <CTRL> key pressed while selecting elements with the mouse or keyboard.
Properties Tool window
The Properties tool window lists all properties of the currently active selection. You can also select multiple elements and the common properties can be modified at once. This is useful if you want to change the background color of several labels at once. Each type of report element has its own set of properties. The top level report element has a Name, Page Definition, Default Locale and Resources Path. Depending on the type of property there are different components to edit value of the property. All those editors are pretty self-explanatory. The most important properties for a report element are printed in bold.
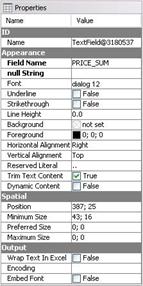
The properties are grouped into different sections depending by the type of influence they can take. All properties listed under ID don't have a direct impact to the visual appearance of the report, but are used to refer to an element from a function or similar.
All properties listed under Appearance have a direct impact on how this report element will look on the report.
All properties listed under Spatial affect the size or position of a report element. These properties usually also have a direct or indirect impact on how the report will look.
All properties listed under Output take effect for some output targets. Font embedding and encoding are only used when a report is stored as a PDF file.
Messages Tool window
The Messages tool window shows at any given time what kind of errors or warnings are available in your current report definition. An error is a problem that prevents the report from being generated. A preview is not possible when an error is shown. A warning is a problem that doas not prevent the report from being generated but means that not all report elements are printed.
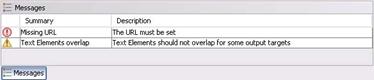
When you select an error or a warning in the Messages tool window the report elements posing the problem are automatically selected if available. If possible the property that needs to be adjusted is also selected in the Properties tool window.
Status bar
The status bar displays descriptions of the commands the mouse is currently hovering over. It also displays the memory consumption of the application. Click on the memory consumption panel to force a garbage collection.

A red blinking icon indicates that an internal error has occurred. Contact the developers of the application and report the error. You can do this by clicking on the blinking icon. A dialog asking for a description of the error appears; enter the description and click Submit.
Warning
If an error occurred, it is recommended to save the report under a different name and to restart the Report Designer. If you are unable to reopen the report, it is important to send the report file to the developers at <reportdesignerbugs@pentaho.org>.