5. Graphical Report Elements
Report elements are the parts that make up a report. For example, graphical elements, functions, groups and datasets are considered the most important report elements. This chapter will deal with just the graphical report elements.
The Structure toolwindow visualizes the hierarchical structure the best:
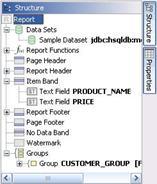
The topmost all-embracing report element is the report itself.
Report
Although, the report is one of the most important elements, it doesn't have many customizable properties. It's a special visual element because most of the characteristic properties for visual elements, size and position, are missing.
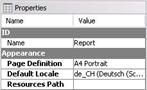
•Name
The name is used by some output targets to set metadata, but is not very important.
•Page Definition
The page definition specifies the page format, orientation and the borders, you can use the ellipsis button to open a configuration dialog.
•Default Locale
The default locale defines what language to use for the localization and also influences how numbers and dates are formatted. It's set to the system default locale.
•Resources Path
Specifies where the resource engine should look for localization files, files containing translations for the languages you want to support.
Bands
The next hierarchical level of the visual elements are the toplevel bands.
Size Properties
• Minimum Size
This is the smallest size an element can have. For bands this size is automatically adjusted to include all contained elements. This is the size mostly set by the designer and is automatically set by placing and resizing elements visually. Most of the time it is perfectly fine to just use this size. The other sizes discussed below are for advanced purposes only.
• Preferred Size
The size that should be used when possible. When not enough space is available the element can also be printed smaller, but not smaller than the minimum size. The preferred size should therefore always be bigger than the minimum size or not set at all (0, 0).
• Maximum Size
The biggest possible size an element can grow, the maximum size must always be bigger than the preferred size or not set at all (0,0). The toplevel bands have some common properties only used in the Report Designer and which do not affect the printed report in any way.
• Visual Height
The height the band occupies in the report definition area. This does not have any effect on the printed report.
• Show in Layout GUI
Whether to show the band in the report definition area. This does not have any effect on the printed report. You can use this to hide bands you don't use to not clutter the user interface.
Page Header Band
The page header band, when not empty, is printed at the top of each page.
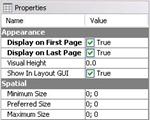
• Display on First Page
Whether to print the page header on the first page or not.
• Display on Last Page
Whether to print the page header on the last page or not.
Report Header Band
The report header band, when not empty, is printed once when the report starts but after the page header band.
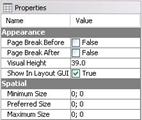
•Page Break Before
Indicates whether to insert a pagebreak just before the header is printed. This does not really have an effect.
• Page Break After
Indicates whether to insert a pagebreak just after the header is printed.
Item Band
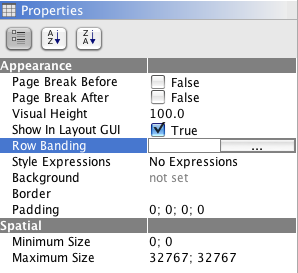
•Page Break Before
Indicates whether to insert a pagebreak before every line. This ensures that only one row is printed per page.
•Page Break After
Indicates whether to insert a pagebreak after every line. This ensures that only one row is printed per page.
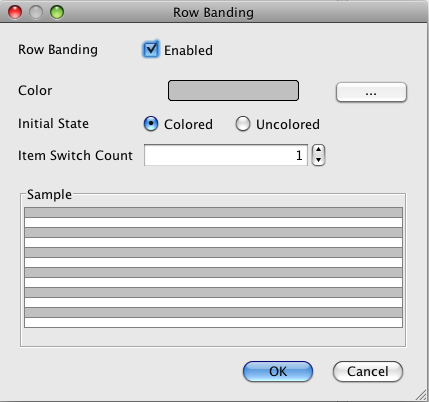
•Row Banding
This allows alternate background colors to be specified when items are printed. Select the Items band to access row banding.
Report Footer Band
The report footer band, when not empty, is printed once when the report ends just before the last page footer is printed.
•Page Break Before
Indicates whether to insert a pagebreak before the footer is printed.
•Page Break After
Indicates whether to insert a pagebreak after the footer is printed.
Page Footer Band
The page footer band, when not empty, is printed at the bottom of each page.
• Display on First Page
Whether to print the page header on the first page or not.
• Display on Last Page
Whether to print the page header on the last page or not.
Watermark Band
The watermark band is printed on the background of every page. You can use it to embed a company logo or to mark a report as draft.
• Page Break Before
Has no effect.
• Page Break After
Has no effect.
NoData Band
The nodata band is printed once and only when there is not one single row of data available.
• Page Break Before
Has no effect.
• Page Break After
Has no effect.
Text Elements
A text element is an element that prints some kind of static text or dynamic text from a dataset on the report. Text elements used to print dynamic values from a dataset have the suffix Field .
Common Properties
• Name
The name or identifier of this report element. It is mainly used to reference fields from functions and is not required for basic reports.
• Font
The font used to print the report element. Note that a large font size requires the element to be big enough, otherwise a warning is shown in the Messages toolwindow and nothing is printed.
• Underline
Whether to underline the text. Always the complete text is underlined, and there is now way to just underline some characters of the text. You have to use lines for this purpose.
• Strikethrough
Whether to strikethrough the text.
• Background
Specifies the background color to fill the element. To remove the background color you have to delete the text in the editor and press Enter.
• Foreground
Specifies the foreground color to paint the text of the element. To remove the foreground color you have to delete the text in the editor and press Enter.
• Horizontal Alignment
How the text should be aligned on the horizontal axis. Available values are Left , Center , Right.
• Vertical Alignment
How the text should be aligned on the vertical axis. Available values are Top , Middle , Bottom.
• Reserved Literal
Specifies the text to use when the text is too long to fit into the elements bounds.
• Trim
Text Content Whether to remove whitespace characters at the start and end of the element.
• Dynamic Content
Whether the elements height should automatically grow to make the element big enough to print all text. You can restrict the growth by setting the maximum size.
• Position
The position of the element in respect to its parent. This property is set whenever you move an element using the mouse.
• Wrap Text In Excel
Whether to make the cell wrap the text when the report is saved as an Excel sheet.
• Encoding
Encoding to use when saving as PDF. Set this to Identity-H when you want to save the report in unicode or some characters are outside the ASCII range. Note that a font should be embedded that supports the foreign characters.
• Embed Font
Whether to embed the font in the generated PDF file. Note that not all fonts are allowed to be embedded.
Label
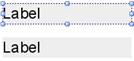
The label is a static report element and the text does not change depending on the dataset, but it can be adjusted using functions.
• Text
The text to print.
Text Field
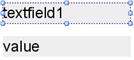
The text field is the most basic dynamic field. It prints the text representation as delivered by the dataset.
• Field Name
The name of the field/column used to get the data from the dataset.
•null String
Text to print when the dataset has no value for the current row, and is null.
Resource Field
The resource field prints a value from a resource bundle that is available for the given key.
•Resource Base
The name of the resource bundle to use. If you have the textfields Translations.properties and Translationsde.properties, the resource base should be set to Translations To make the resource bundles available to th reporting engine, you have to set the resources path property on the report.
• Field Name
The name of the field/column used to get the key from the dataset.
• null String
Key to use when the dataset has no value for the current row, and is null.
Date Field
The date field formats and prints a date from the dataset.
•Format
Specifies how the data should be formatted.
Table 5.1. Format Symbols Letter Date or Time Component |
|
|---|---|
G |
Era designator |
y |
Year |
M |
Month in year |
w |
Week in year |
W |
Week in month |
D |
Day in year |
d |
Day in month |
F |
Day of week in month |
E |
Day in week |
a |
Am/pm marker |
H |
Hour in day (0-23) |
k |
Hour in day (1-24) |
K |
K Hour in am/pm (0-11) |
h |
h Hour in am/pm (1-12) |
m |
m Minute in hour |
s |
s Second in minute |
S |
S Millisecond |
z |
z Time zone |
Z |
Z Time zone |
Examples
Era designator 1996 96 July Jul 07 27 2 189 10 2 Tuesday Tue PM 0 24 0 12 30 55 978 Pacific Standard Time PST GMT-08:00 -0800
The name of the field/column used to get the date from the dataset.
• null String
Text to use when the dataset has no value for the current row, and is null.
• Excel Date Format
Format to use when exporting to an Excel sheet.
Message Field
The message field formats and prints one or multiple values from the dataset and formats the values according to the specified format. This field is the most powerful one and can be used to replace the ordinary text-, number-and date fields.
•Format String
Specifies how the text of the field should be assembled. Unformatted fields can be specified as $(fieldname) . When you want to format a field as a number you can append number to the format like $(fieldname, number) . If you additionally want to format the number according to a custom format, you can use $(fieldname, number, HH:mm:ss) . The same applies to date formatting: $(fieldname, date, dd.MM.yyyy) .
You can also use this field to print values from multiple columns from the dataset: e.g. you could print the combined customer names with Customername: $(FIRSTNAME) $(LASTNAME) .
•null String
Text to use when the dataset has no value for the current row, and is null.
Number Field
The number field formats and prints a number from the dataset and formats the value according to the specified format.
•Format Specifies how the number should be formatted.
The name of the field/column used to get the number from the dataset.
•null String
Text to use when the dataset has no value for the current row, and is null.
• Excel Format
Format to use when exporting to an Excel sheet.
Table 5.2. Format Symbols |
Symbol |
Location Localized |
*Meaning* |
|---|---|---|---|
|
0 |
Number Yes |
Digit |
|
Number Yes |
Digit, zero shows as absent |
|
|
. |
Number Yes |
Decimal separator or monetary decimal separator |
|
Number Yes |
Minus sign |
|
|
, |
Number Yes |
Grouping separator |
|
E |
Number Yes |
Separates mantissa and exponent in scientific notation. Need not be quoted in prefix or suffix. |
|
|
Subpattern boundary Yes |
Separates positive and negative subpatterns |
|
% |
Prefix or suffix Yes |
Multiply by 100 and show as percentage |
|
u2030 |
Prefix or suffix Yes |
Multiply by 1000 and show as per thousand value |
|
¤(u00A4) |
Prefix or suffix No |
Currency sign, replaced by currency symbol. If doubled, replaced by international currency symbol. If present in a pattern, the monetary decimal separator is used instead of the decimal separator. |
|
' |
Prefix or suffix No |
Used to quote special characters in a prefix or suffix, for example,"'#'#" formats 123 to "#123". To create a single quote itself, use two in a row:"# o''clock". |
Image Field
A field used to print dynamic images delivered by a database.
• Field
Name The name of the field/column used to get the data from the dataset.
• Keep Aspect
Whether to preserve the aspect ration of the image or to stretch the image to fit the defined area.
Static Image
An element used to print a static image available on the hard disk or available as a URL. You can use this element to print a company logo in the report header band.
• URL
The URL to the image. You can also drag&drop images from the local hard drive directly onto the report definition area.
• Keep Aspect
Whether to preserve the aspect ration of the image or to stretch the image to fit the defined area.
Line
An element used to print a horizontal or vertical line on the report.
• Color
Specifies the color used to draw the line.
• Line Width
Specifies the thickness of the line.
•Direction
Specifies the direction of the line. Possible values are Horizontal and Vertical .
Rectangle
An element used to print a rectangle on the report.
•Color
Specifies the color used to draw/fill the rectangle.
• Fill
Whether to fill the rectangle or not.
•Draw
Whether to draw the rectangles outline or not.
•Line Width
Specifies the thickness of the line used to outline the rectangle.
Drawable Field
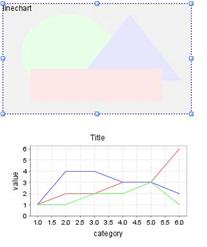
A field used to draw a drawable. A drawable can be a chart or some other component usually emitted by a function.
• Field Name
The name of the field/column used to get the data from the dataset.
Subband
A special element used to group elements together. This is especially useful to print multiple elements with dynamic content.
NOTE: This element is not available on Pentaho Report Designer 3.8.0GA. Unless it is available on newer versions, please get rid of this section, but please do document any element that is supposed to help with layout.
• Layout
The type of Layoutmanager to use to arrange the contained elements. Valid values are Stacked to arrange elements under each other or Null to disable automatic layout.