Monitoring Mondrian System Metrics with Java Management Extensions (JMX)
Starting with Mondrian 3.7, you can monitor system metrics by using JMX. This allows accessing real time information about the queries currently being executed on the server. Aggregate metrics like cellCacheHitCount and sqlStatementExecuteNanos are also exposed for the server. See the table below for the complete list of metrics with their descriptions.
JMX Configuration
In order to access Mondrian metrics from a JMX client, you'll need to first configure the JVM process running biserver. For example, to set up unsecured remote JMX access on port 7199, add the following JVM parameters to the CATALINA_OPTS variable in start-pentaho.sh:
-Dcom.sun.management.jmxremote.port=7199
-Dcom.sun.management.jmxremote.authenticate=false
-Dcom.sun.management.jmxremote.ssl=false
After restarting biserver, you should be able to connect using a JMX client (e.g. JConsole, Nagios, Splunk) with the connection string service:jmx:rmi:///jndi/rmi://servername:7199/jmxrmi.
See http://docs.oracle.com/javase/7/docs/technotes/guides/management/agent.html for more information on JMX configuration.
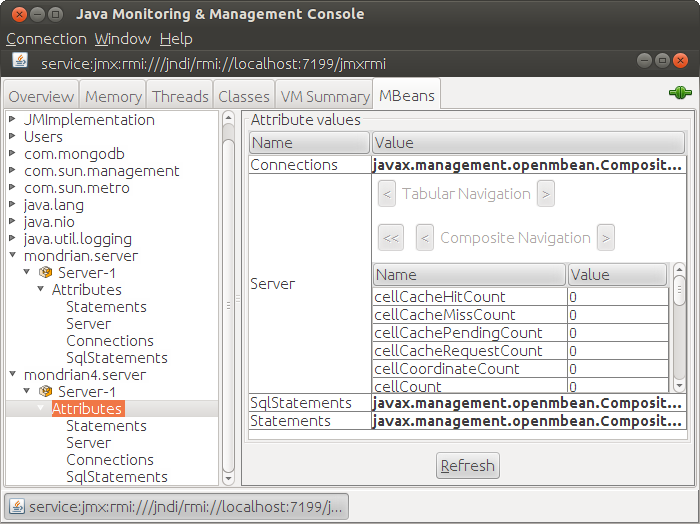
The screenshot below shows the MXBeans that are available. Note that there are two separate namespaces for Mondrian metrics: mondrian.server and mondrian4.server. Separate namespaces allows metrics to be collected when both Mondrian 3.7 and 4.0 are running within the same container. If more than one instance of the same version of Mondrian is running within a container, each will be given a unique id (e.g. Server-1, Server-2, etc.).
Metrics
The following table lists the metrics available, along with a brief description. Within the "Server" attribute these metrics are aggregated across the whole server. Similarly, each Connection, Statement and SqlStatement object within their respective arrays have metrics aggregated at the appropriate level. For example, querying the sqlStatementExecuteCount value of a Statement object will retrieve the total time spent in SQL execution for that single MDX statement. Note that each of these attributes reflect the current state of the system. Statements and Connections will be removed from the monitor on completion, but their aggregate statistics will be persisted.
Name |
Description |
|---|---|
cellCacheHitCount |
The count of cache hits. |
cellCacheMissCount |
The count of cache misses. |
cellCachePendingCount |
A count of requests for cells that are in the process of being loaded into |
cellCacheRequestCount |
The total number of requests made for cells from the cache. |
cellCount |
The number of cells currently in cache. |
cellCoordinateCount |
The sum of the dimensionality of every cells currently in cache. |
connectionCurrentlyOpenCount |
The number of connections currently open. Should equal |
connectionEndCount |
The number of completed connections. |
connectionStartCount |
The number of started connections. |
executeEndCount |
A count of MDX statements that have finished execution. |
executeStartCount |
A count of MDX statements that have started execution. |
segmentCount |
The number of segments currently in cache. |
segmentCreateCount |
The number of segments currently in cache. This should be equal to |
segmentCreateViaExternalCount |
The number of segments placed into the cache by an external cache. For example, |
segmentCreateViaRollupCount |
The number of segments created by rolling up already loaded segments. |
segmentCreateViaSqlCount |
The number of segments created by issuing SQL. |
segmentDeleteViaExternalCount |
The number of segments deleted from an external cache. |
sqlStatementCellRequestCount |
Total, over all SQL statements that are fetching cells into cache, of |
sqlStatementCurrentlyOpenCount |
number of SQL statements currently executing. |
sqlStatementEndCount |
number of SQL statements finished execution. Incremented when the |
sqlStatementExecuteCount |
The total number of SQL statements that have execution. Incremented after |
sqlStatementExecuteNanos |
The total nanoseconds elapsed during SQL execution. |
sqlStatementRowFetchCount |
Total number of rows fetched. |
sqlStatementStartCount |
The total number of SQL statements started. Incremented immediately before |
statementCurrentlyExecutingCount |
The number of statements currently executing. In some cases (e.g. when using |
statementCurrentlyOpenCount |
The number of statements currently open. |
statementEndCount |
The total number of completed statements. |
statementStartCount |
The total number of statements started. This number is incremented when the |
|
|