...
- Your first step is to make sure that the Pentaho sample data is up and running. If you haven't done it yet, you should unzip the pentaho demo data package to a working directory.
- Start your sample databases using the start_hypersonic.bat (or .sh, depending on platform) file in the root directory of the demo data that you just unzipped. You should see a new command window with several Hypersonic messages displayed. This is a good indication that your databases started successfully.
- Next, unzip the Pentaho Report Designer to a directory of your choice. Start the designer using the startdesigner.bat (or .sh, depending on platform) file in the root directory.
- The easiest way to get your report started is to walk through the designer's Report Wizard. From the File menu, select the Report Wizard... option.
- The first step in the wizard is to select the type of dataset that you want to use in your report. For our example, we want to use a JDBC Dataset, so select the "JDBC dataset" from the combo box. Choose the Next button.
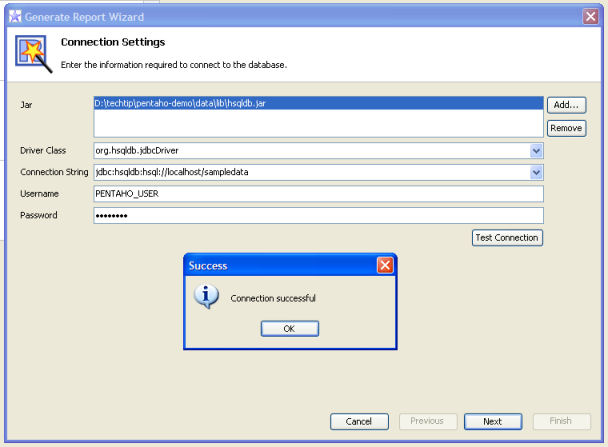
- The next step in the wizard asks for your Connection Settings. These are the parameters that you need to define in order to connect to your database. Add the following connection information:
- Jar: Location of the hsqldb.jar - This jar can be found under the Pentaho demo data directory, in the lib directory. So, if you installed the demo data to d:\pentaho-data, then the hsqldb.jar is located at d:\pentaho-data\lib\hsqldb.jar.
- DriverName: org.hsqldb.jdbcDriver
- Connect String: jdbc:hsqldb:hsql://localhost/sampledata
- User Name: PENTAHO_USER
- Password: password
- Click the Test Connection button to see if your connection settings work. If you get a "Connection Successful" dialog, then you are golden! Click the Next button to move on.
- This step in the wizard is where you define your query. Enter select * from quadrant_actuals in the text box on the right. Click the Preview... button to preview your data, and be certain that your query is error-free. As soon as everything looks right, click Next.
- The next step in the wizard allows you to select which fields in the query resultset will be visible in the report. We don't need to change anything here, so click Next to move on.
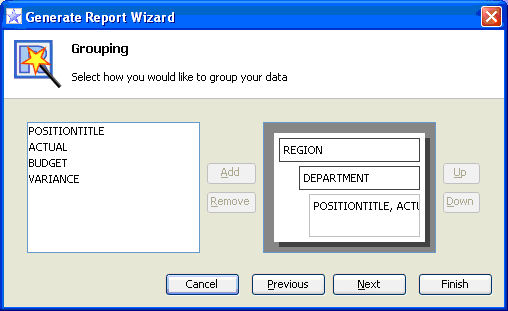
- You will define levels of grouping the data in the next step. We want to group by Region and Department in our report. So, select Region from the left hand list, and click the Add button to move it over as a group on the right. Do the same now for Department.
- The next step allows us to define functions for our grouped data. We want to sum ACTUAL, BUDGET and VARIANCE numbers in our report. So, in the Function column, select ItemSumFunction as the function for Actual, Budget and Variance fields.
- The next step affects the appearance of our report. Change the Template from Block to Indented. Click the Finish button.
- We now have the beginnings of a nice report. To preview your report with data in it, choose the Preview button on the bottom of the report design page.
...