Introducing the Pentaho Report Designer
May 31, 2006
Submitted by Mike D'Amour, Pentaho Team Developer
This week's technical tip is an introduction to the Pentaho Report Designer, the newest open source addition to the Pentaho project. In this article, I will use the Report Designer to build a JFreeReport against the Pentaho sample data, the output being very similar to the Quadrant Report in the demo samples.
Resources Before You Get Started
You will want to have the following on available on your computer before we get started:
- Pentaho demo data, version 1.1.6 and up (the constraint is actually that Report Designer integration works with the platform version 1.1.6 and higher )
- Pentaho Report Designer, version 1.1.6 build 10001 or later
- The Pentaho Report Designer requires JRE 1.5 - You can get the latest update of the JRE here.
Step-By-Step: Starting With the Designer's Report Wizard
- Your first step is to make sure that the Pentaho sample data is up and running. If you haven't done it yet, you should unzip the pentaho demo data package to a working directory.
- Start your sample databases using the start_hypersonic.bat (or .sh, depending on platform) file in the root directory of the demo data that you just unzipped. You should see a new command window with several Hypersonic messages displayed. This is a good indication that your databases started successfully.
- Next, unzip the Pentaho Report Designer to a directory of your choice. Start the designer using the startdesigner.bat (or .sh, depending on platform) file in the root directory.
- The easiest way to get your report started is to walk through the designer's Report Wizard. From the File menu, select the Report Wizard... option.
- The first step in the wizard is to select the type of dataset that you want to use in your report. For our example, we want to use a JDBC Dataset, so select the "JDBC dataset" from the combo box. Choose the Next button.
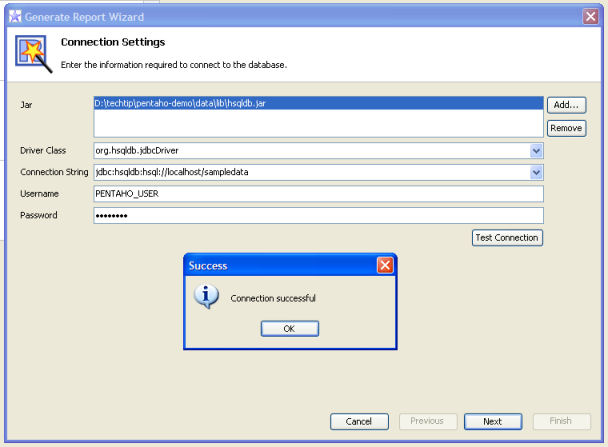
- The next step in the wizard asks for your Connection Settings. These are the parameters that you need to define in order to connect to your database. Add the following connection information:
- Jar: Location of the hsqldb.jar - This jar can be found under the Pentaho demo data directory, in the lib directory. So, if you installed the demo data to d:\pentaho-data, then the hsqldb.jar is located at d:\pentaho-data\lib\hsqldb.jar.
- DriverName: org.hsqldb.jdbcDriver
- Connect String: jdbc:hsqldb:hsql://localhost/sampledata
- User Name: PENTAHO_USER
- Password: password
- Click the Test Connection button to see if your connection settings work. If you get a "Connection Successful" dialog, then you are golden! Click the Next button to move on.
- This step in the wizard is where you define your query. Enter select * from quadrant_actuals in the text box on the right. Click the Preview... button to preview your data, and be certain that your query is error-free. As soon as everything looks right, click Next.
- The next step in the wizard allows you to select which fields in the query resultset will be visible in the report. We don't need to change anything here, so click Next to move on.
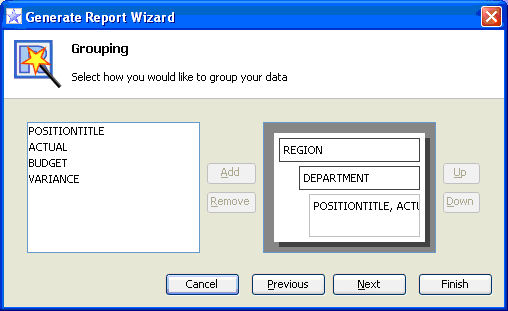
- You will define levels of grouping the data in the next step. We want to group by Region and Department in our report. So, select Region from the left hand list, and click the Add button to move it over as a group on the right. Do the same now for Department.
- The next step allows us to define functions for our grouped data. We want to sum ACTUAL, BUDGET and VARIANCE numbers in our report. So, in the Function column, select ItemSumFunction as the function for Actual, Budget and Variance fields.
- The next step affects the appearance of our report. Change the Template from Block to Indented. Click the Finish button.
- We now have the beginnings of a nice report. To preview your report with data in it, choose the Preview button on the bottom of the report design page.
Step-By-Step: Sprucing Up the Report
Now that we have the general layout of the report, let's explore a few of the designer's many features.
We are now looking at the report in a WYSIWYG design mode. Components can be drag-n-dropped from the palette on the left. Report components can be configured using their properties on the right. Component sizes can be adjusted by hand.
- Double-click on the Report Title and change it to "Report: Dept by Region".
- Click on the Group Header component that says "REGION: $(REGION)". In the Properties view in the lower right corner of the screen, click the Background property. Change the background color to 239;101;7. These are the RGB values, you can also use the ellipses button to select a color from the color chart.
- Click on the Group Header component that says "DEPARTMENT: $(DEPARTMENT)". In the Properties view in the lower right corner of the screen, click the Background property. Change the background color to 134;156;0. These are the RGB values, you can also use the ellipses button to select a color from the color chart.
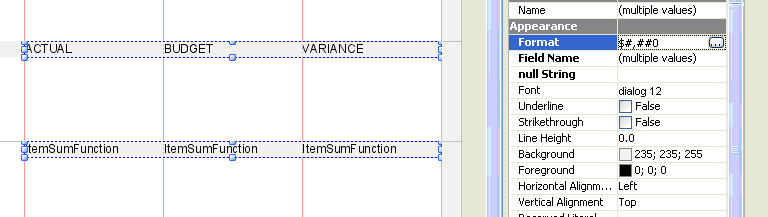
- The ACTUAL, BUDGET and VARIANCE fields in the Item Band are by default created as text fields. This is also true for ItemSumFunctions in the Group Footer. We want these fields to be numeric. While holding down the <CTRL> key, click all six of the fields. Right-click on one of the highlighted items and select Morph | Morph Into Number Field. Now these fields will support numeric formatting.
- In the Properties view, click the Format property. Change its value to $#,##0. When the data is processed we'll see that it is formatted for USD.
- We'd also like to add page breaking after each group. To do this, browse the Structure view in the upper right corner of the screen. Open the Groups item in the tree until you see the DEPARTMENT_group. Open this group and click on its Group Footer. In the Properties view, check the property Page Break After.
- The final touch on this report is to change the font on the ItemSumFunction components to a bold font. Select all three elements using the same technique described previously. In the Properties view, click the Font property, and select Bold.
- Click the Preview button to view the report. There is no limit to the complexity of the reports that can be produced. I encourage you to explore the Palette view - notice that there are lines, images, bands and other features. These can be used to create very custom looks for reports.
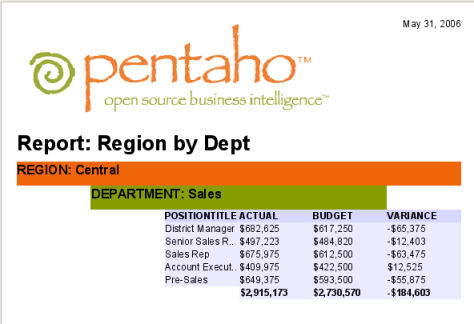
This report may be saved in the Report Designer format, then later re-opened for editing. You can also generate JFreeReport XML and drop it into a Pentaho solution along with an action sequence and the report would now run in the Pentaho platform.