Step performance monitoring
Introduction
As of version 3.1.0 of Pentaho Data Integration, we are introducing a way to track the performance of individual steps in a transformation. This is an important tool that allows you to fine-tune performance of transformation because that performance is determined by the slowest step in the transformation.
A check list for PDI performance tuning can be found here.
Enabling monitoring
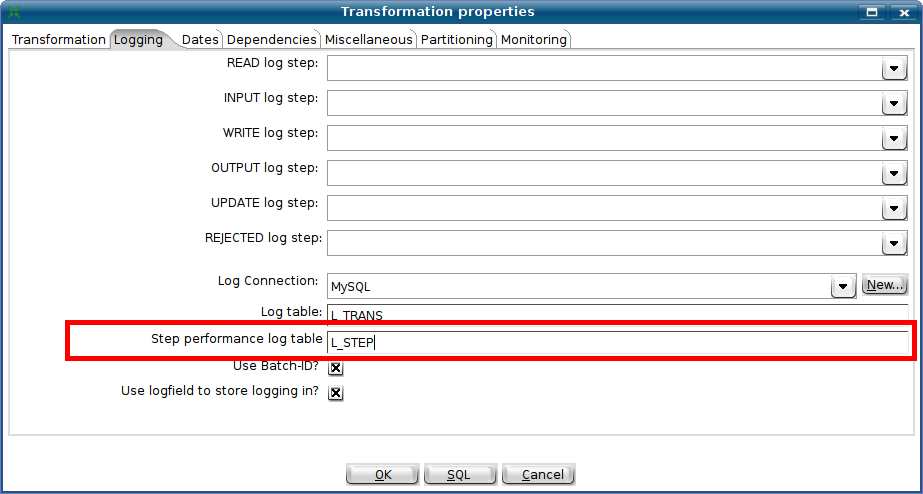
You can enable the step performance monitoring in the transformation settings dialog:
As you can see, this option is NOT enabled by default as it may cause memory consumption problems for long running transformations. By default, every second a performance snapshot is taken for all the running steps. This is not a CPU intensive operation and it should not have any big impact on performance. However, if you have a lot of steps or if you take a lot of snapshots (several per second for example), there is obviously going to be some negative impact on performance that you should be aware off.
Also be aware that if you run in Spoon you will consume a fair amount of CPU power just by updating the JFreeChart graphics in the performance tab. Running headless (Kitchen, Pan, Carte, Pentaho platform, ...) does not have that drawback and should give you fairly accurate performance numbers without too much of a penalty (if any at all).
Saving step performance logging
All the step performance data being kept in memory during the execution of the transformation. However, at the end of the transformation, you can opt to save the data into a logging table:
If you specify the logging connection and the step performance log table, the snapshot data is saved to the specified table at the end of the transformation.
Please not that you can use the SQL button to generate the logging target table. For the step performance log table, this is SQL that could be generated for MySQL:
CREATE TABLE L_STEP
(
  ID_BATCH INT
, SEQ_NR INT
, LOGDATE DATETIME
, TRANSNAME VARCHAR(255)
, STEPNAME VARCHAR(255)
, STEP_COPY INT
, LINES_READ BIGINT
, LINES_WRITTEN BIGINT
, LINES_UPDATED BIGINT
, LINES_INPUT BIGINT
, LINES_OUTPUT BIGINT
, LINES_REJECTED BIGINT
, ERRORS BIGINT
, INPUT_BUFFER_ROWS BIGINT
, OUTPUT_BUFFER_ROWS BIGINT
)
;
Performance graphs
If you configured step performance monitoring as shown above, with the database logging being optional of-course, it is also possible to get performance evolution graphs by using the "Graph" button in the logging tab of the running transformation.
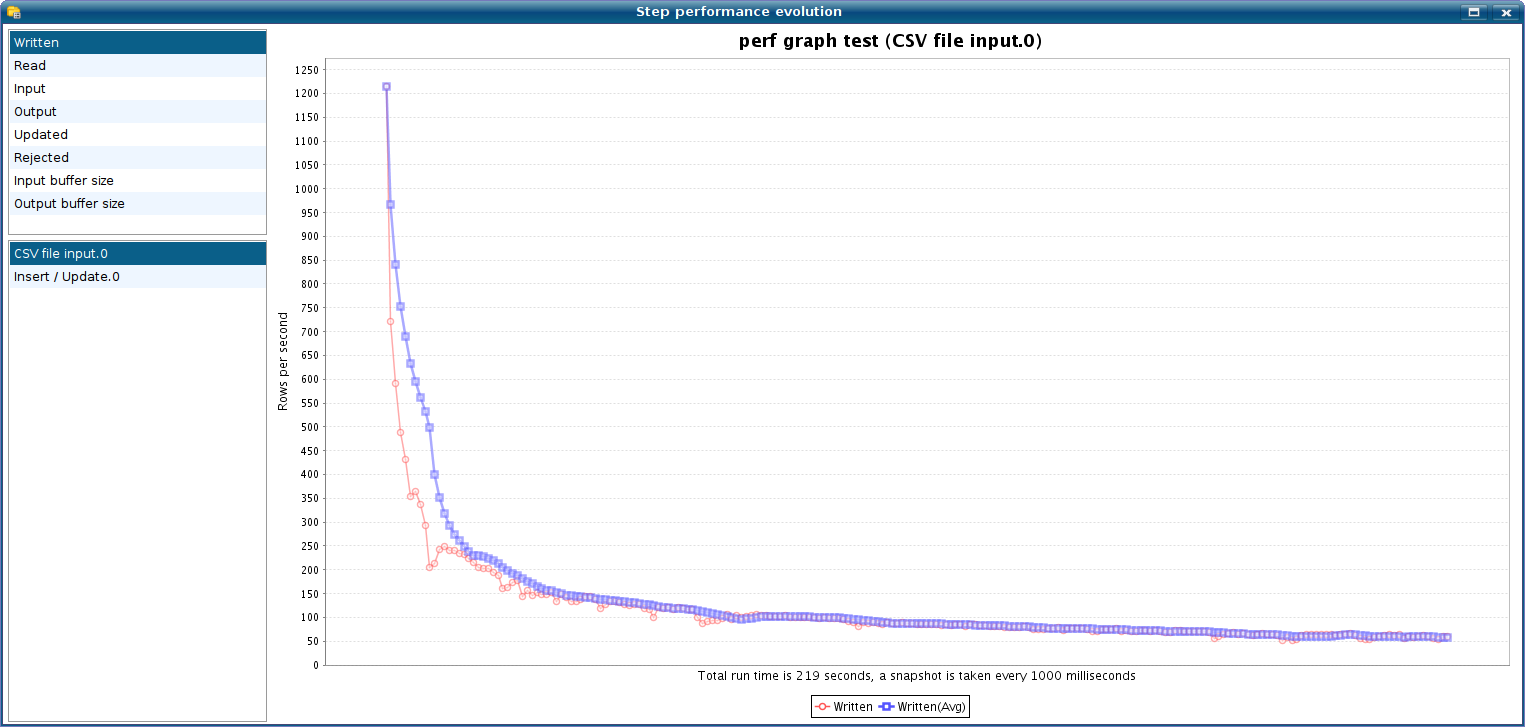
This is the typical graph for a transformation where an index is needed on a target table. The table grows in size and because the lookups cause full table scans, the transformation keeps getting slower:
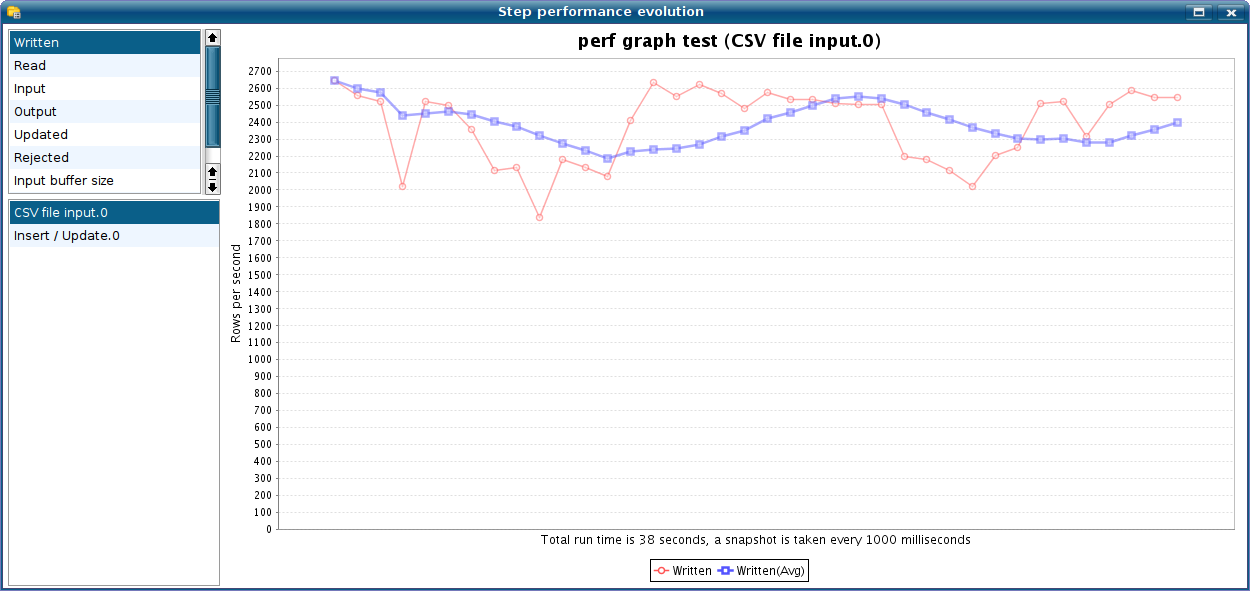
The solution in this case is then to add an index to the target table giving a flatter performance evolution:


