Cost Benefit Analysis
The Cost/Benefit analysis component is a new visualization tool that was released in Weka versions 3.6.2 and 3.7.1. The tool is particularly useful for the analysis of predictive analytic outcomes for direct mail campaigns (or any ranking application where costs are involved). It allows the user to explore various cost/benefit tradeoffs by interactively selecting different population sizes from the ranked list of prospects or by varying the threshold on the predicted probability of the positive class.
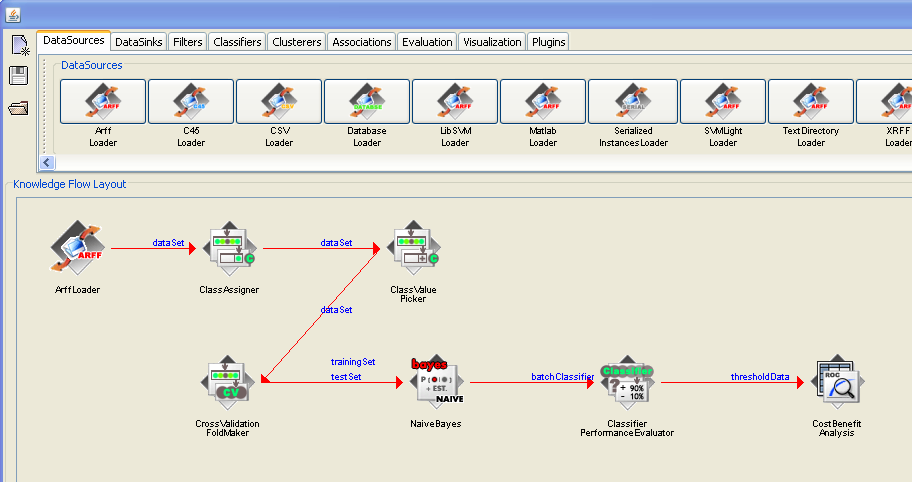
The Cost/Benefit analysis tool is available from both the Explorer and Knowledge Flow user interfaces. In the figure below, the Knowledge Flow is being used to build a predictive model for a real-world direct mail application. The data is historical campaign data from a mail out to solicit donations to a charitable organization. The data set contains 47,706 records with 476 variables (summary variables for donor lifetime giving history, overlay demographics etc.). The percentage of donors in the data is approximately 5%. A 10-fold cross-validation is used to generate predictions from a naive Bayes classifier, and these are then passed to the Cost/Benefit analysis tool.
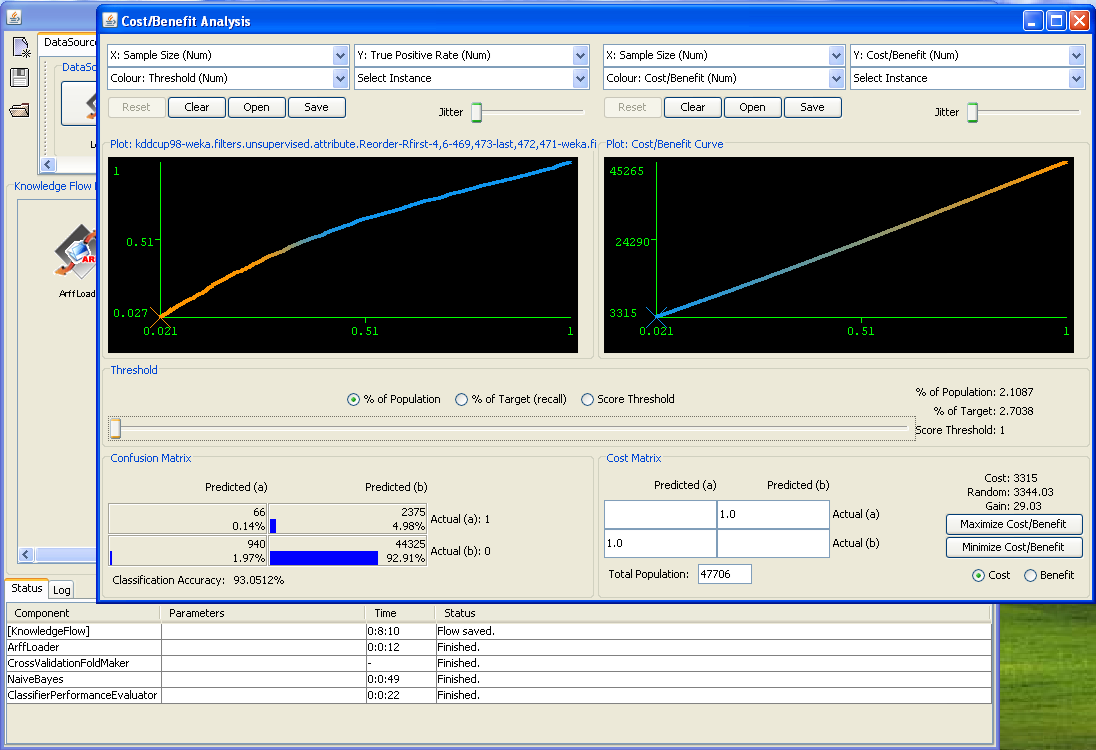
In the next figure, the Cost/Benefit tool has been popped up. The tool displays a cumulative gains chart on the left, and a cost/benefit plot on the right. A slider is provided to allow the user to explore the cost/benefit associated with various subsets of the population, various levels of recall (percentage of target) or various thresholds on the probability of predicting the positive class. The cost/benefit that can be expected by chance is also shown.
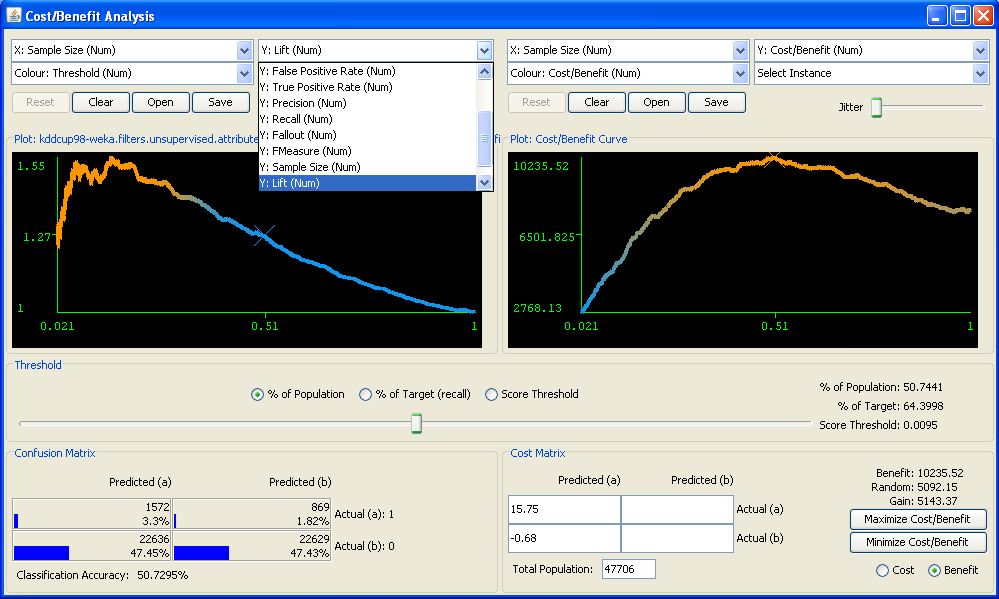
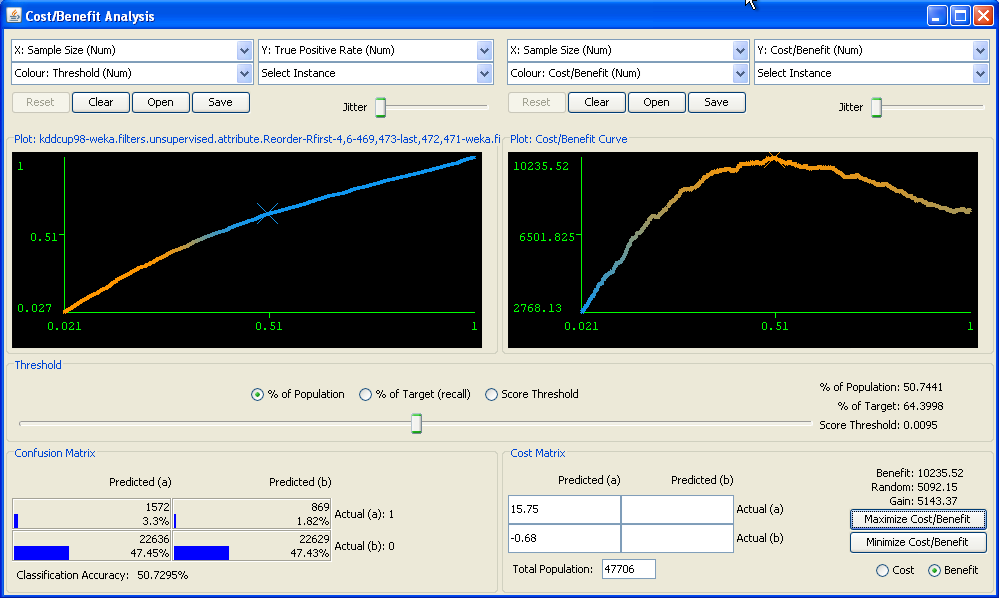
In this example direct mail data set the average donation made by responders to the campaign was $15.75 and the cost of mailing was $0.68. We can enter these values into the cost matrix and explore the profit to be made by mailing to various subsets of the population. Clicking the "Maximize Cost/Benefit" button will automatically determine how deep to mail into the list in order to maximize the profit. In this case, we can see that mailing out to the top 50.74% of the population results in a profit of $10,235.52, and a gain of $5,143.37 over mailing out to a random subset of the same size.
All of Weka's threshold curve types are available in the Cost/Benefit tool. The following figure shows a lift curve being displayed rather than a cumulative gains chart.