Lego Bar Chart
This page contains instructions on building a Lego Bar Chart, which was demonstrated at the Google I/O Conference Sandbox. The Lego project consists of 5 bars driven by independent motors, along with Java software that can accept data from an IPentahoResultSet within Pentaho's BI Platform.
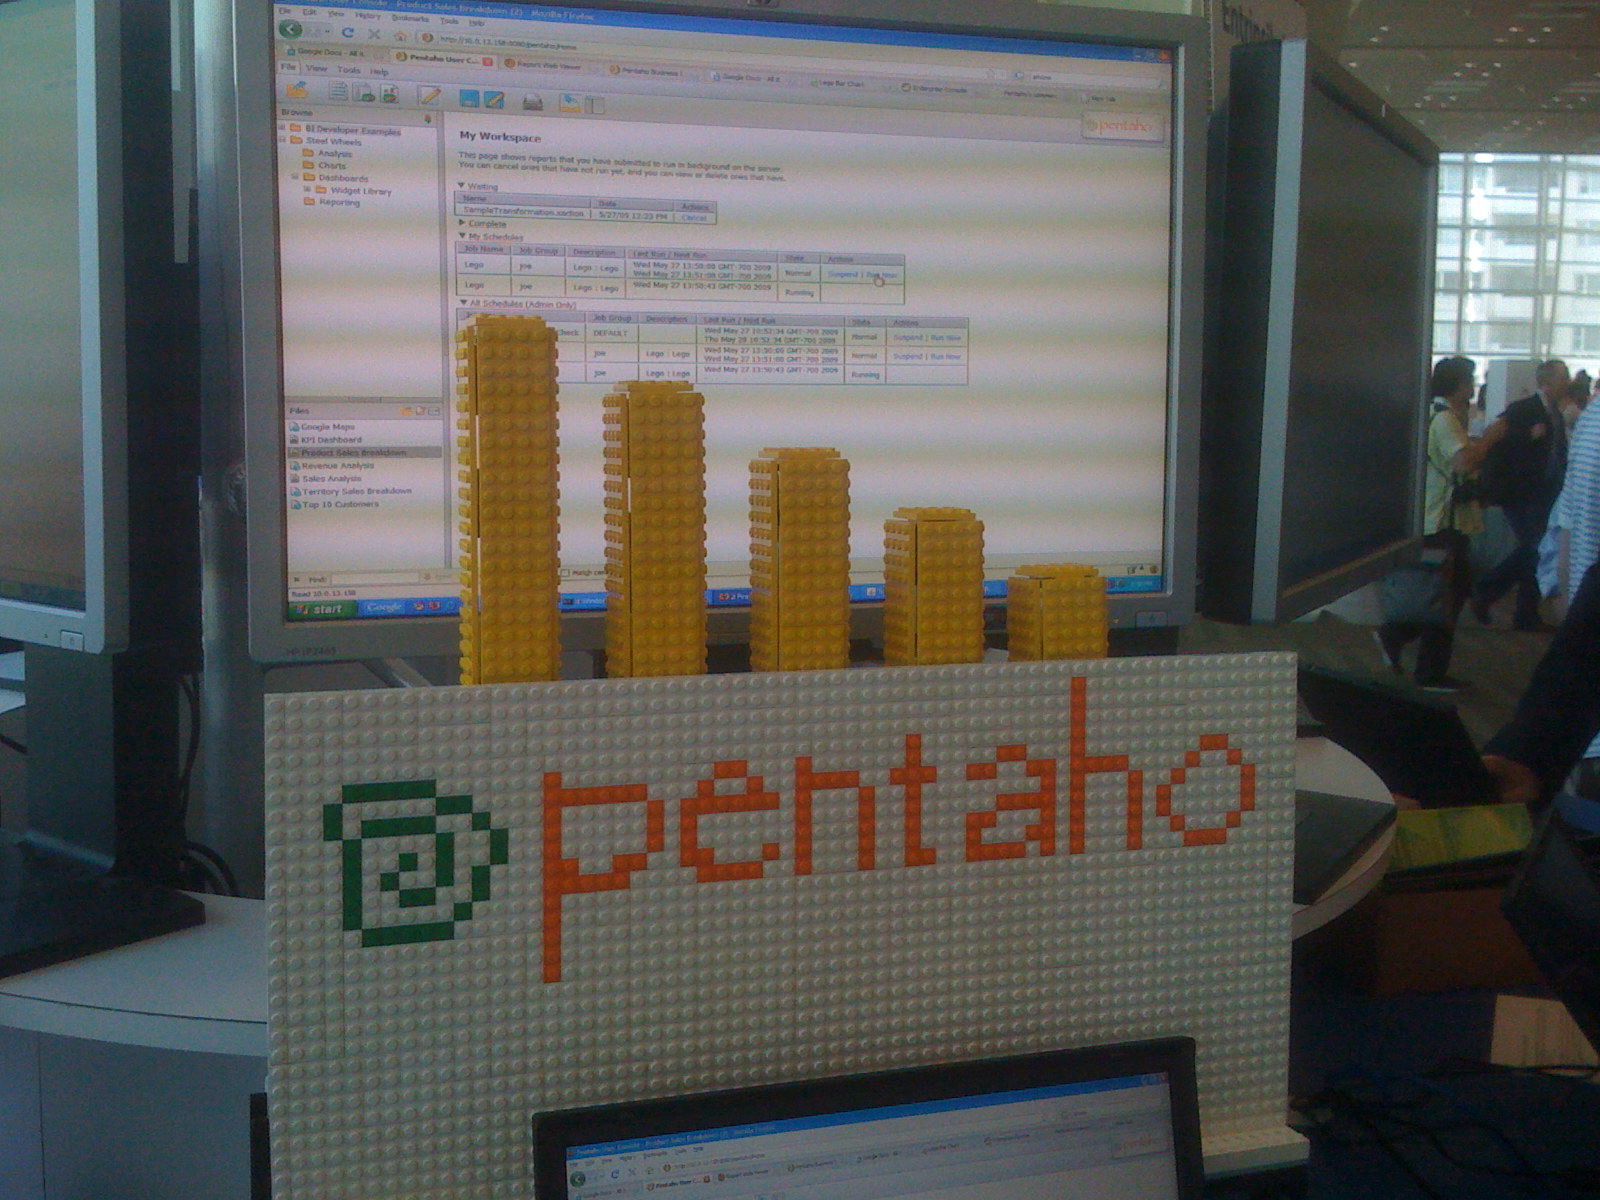
Step 1: Build the bar chart
The software included in this demo assumes that you've built a 5 bar barchart, but it would be simple to modify the source code to add or remove bars. Follow the attached Lego instructions for building a single bar. See the parts.txt for a complete list of parts required. 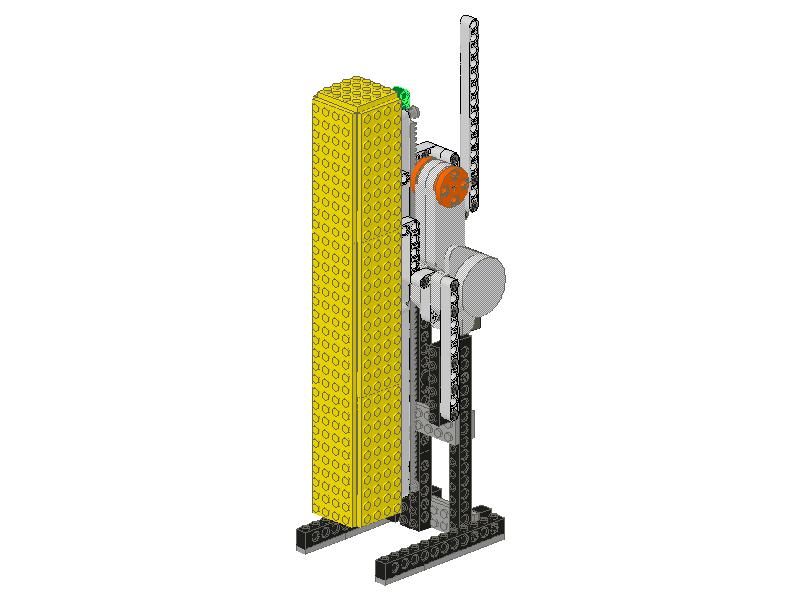
Step 2: Install the necessary software
This demo uses LeJOS NXJ, you can download the distribution here. Also, this demo assumes that you have an installed Pentaho BI Platform, version 3.0 or newer.
Step 3: Install the LegoPojo and default Action Sequence
First, copy the bin/org folder into biserver/tomcat/webapps/pentaho/WEB-INF/classes. Also copy the LegoBarChart.xaction file into steel-wheels. This action sequence generates a demo dataset and renders the chart based on that data. At the Google I/O 2009 Sandbox, Pentaho demonstrated integrating an Inline ETL process with access to a Google Docs Spreadsheet.
You'll need to restart your webserver so the LegoPojo.class gets loaded appropriately.
Step 4: Install and start the Lego BarChart Server
Once you've installed LeJOS on your machine and on a Lego's NXT programmable brick (or two), place the included nxjbarserver.bat and .class files in the bin folder of LeJOS NXJ. Make sure you have the NXT bricks plugged into the USB port, as well as making sure they are powered on. Now start the nxjbarserver.bat file. If you want to change the number of NXT's involved in the demo, you'll need to modify the server code accordingly.
Make sure to have all your bar charts set to the lowest level, and then run nxjbarserver.bat, which should detect the two NXT bricks.
Step 5: Run the Action Sequence
Once you have everything configured, log into the BI Server and run the Lego Bar Chart action sequence located in the Steel Wheels folder. This should animate the chart. From there, you could create a schedule for this action sequence and have the platform continuously rendering data from a data source.
Enjoy!