MDX Calculations - Percentage Shares and Allocations
November 7, 2006
Contributed by Chris Webb, Crossjoin Consulting
This technical article was generously contributed by Chris Webb, an OLAP guru and independent consultant (check him out at Crossjoin Consulting, or on his blog). Chris also has written a book on MDX called 'MDX Solutions', that you can get here once you are looking to go deep with Mondrian and MDX!
In the first article in this series, we looked at how to use MDX to create calculations which looked along a level on a dimension ? calculations such as previous period growths. It is equally common, however, to want to be able to create calculations which look up (or down) a dimension, for example when calculating percentage market shares. It is this class of calculation we'll be looking at in this article.
Resources Before You Get Started
To run the queries that Chris presents in this technical article, you will need JPivot, hooked up to the SteelWheelsSales sample cube. You can get both of these pre-configured and ready to use out of the box in the Pentaho Pre-configured Installation (PCI). Just navigate to the Steel Wheels Analysis Samples, and select the MDX Query button from the JPivot toolbar.
- Pentaho Pre-configured Installation (PCI) running locally, and the hypersonic database running locally with the SampleData database, version 1.2 or later.
Navigating Vertically With MDX
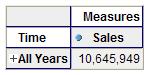
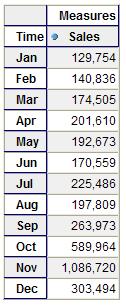
Before we start trying to write any calculations, though, let's take a look at some useful MDX functions which allow us to navigate up and down a dimension. Take a look at the following query which shows sales for the year 2003 : select
{[Measures].[Sales]} ON COLUMNS,
{[Time].[All Years].[2003]} ON ROWS
from [SteelWheelsSales]
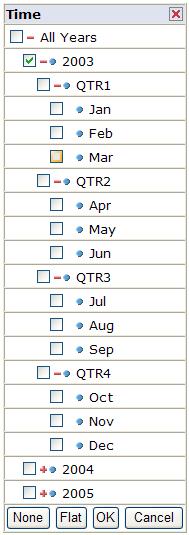
Take some time to drill up and down through the Time dimension and you'll see that it consists of four levels: an All level, a Year level, a Quarter level and a Month level, in that order. This means that each Year consists of four Quarters and each Quarter consists of three Months; all the members on the Time dimension can be thought of being arranged in a tree structure with the single member on the All level, the All Member, at the top and the Months right at the bottom, and indeed you can see it displayed as such if you open the OLAP Navigator:
If we want to find out which member is above any given member in a query, or which members are immediately below any given member, we can use the PARENT and CHILDREN functions. So, for example, the following query shows how the PARENT function works:
select {[Measures].[Sales]}
ON COLUMNS,
{[Time].[All Years].[2003].Parent}
ON ROWS
from [SteelWheelsSales]
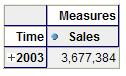
The member immediately above the Year 2003, its 'parent', is the All Member. Similarly, the following query shows that when you apply the PARENT function to the first Quarter in 2003 you get the Year 2003:
select
{[Measures].[Sales]} ON COLUMNS,
{[Time].[All Years].[2003].[QTR1].Parent} ON ROWS
from [SteelWheelsSales]
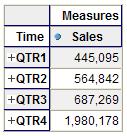
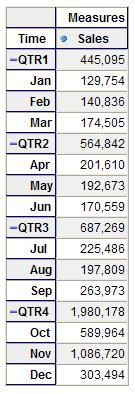
The CHILDREN function allows you to return the set of members immediately below any given member. For example, the following query returns all the Quarters in 2003:
select {[Measures].[Sales]}
ON COLUMNS,
{[Time].[All Years].[2003].Children}
ON ROWS
from [SteelWheelsSales]
We don't need to restrict ourselves to looking up or down one level in the hierarchy, either. The ANCESTOR function allows us to look up more than one level, for example:
select
{[Measures].[Sales]} ON COLUMNS,
{Ancestor([Time].[All Years].[2003].[QTR1].[Jan],
[Time].[Years])} ON ROWS
from [SteelWheelsSales]
returns the Year 2003 again, the 'ancestor' of the month January 2003 at the Years level. The DESCENDANTS function, naturally enough, does the opposite and lets us find the descendants of a member in the hierarchy at one or more levels. The following query returns all the Months in the Year 2003:
select {[Measures].[Sales]}
ON COLUMNS,
{Descendants([Time].[All Years].[2003], [Time].[Months])}
ON ROWS from [SteelWheelsSales]
There are a number of flags which can be supplied in the third parameter to DESCENDANTS about which I won't go into in detail (I'm afraid you'll have to look them up! See http://mondrian.sourceforge.net/api/mondrian/olap/fun/DescendantsFunDef.Flags.html for a complete list), but here's an example using the SELF_AND_AFTER flag:
select
{[Measures].[Sales]}
ON COLUMNS,
{Descendants([Time].[All Years].[2003], [Time].[Quarters], SELF_AND_AFTER)}
ON ROWS from [SteelWheelsSales]
This, as you can see, returns all of the descendants of the Year 2003 at the Quarters level and all levels below the Quarters level.
Using Vertical Navigation in MDX Calculations
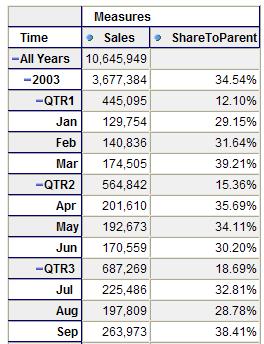
We can now begin to use these functions in our own calculated measures. Let's start by trying to find out the percentage share that a member makes up of its parent's value; what we want to do here is to divide the value of a measure for the current member on a dimension by the value of the measure for the current member's parent. The PARENT function allows us to construct the tuple we need to get the latter value, and here's a full query showing the calculated measure defined in the WITH clause:
with member [Measures].[ShareToParent] as '[Measures].[Sales]/([Measures].[Sales], [Time].CurrentMember.Parent)',
format_string='0.00%'
select
{[Measures].[Sales],[Measures].[ShareToParent]}
ON COLUMNS, Time.Members ON ROWS
from [SteelWheelsSales]
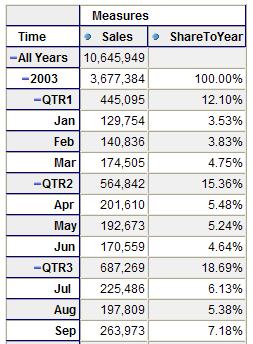
Rather than find the percentage compared to the current member's parent, we might want to calculate the percentage based on the ancestor at a given level ' for example find the percentage of a Quarter or Month value relative to the Year it's in. We can use the ANCESTOR function to do this:
with member [Measures].[ShareToYear] as
'[Measures].[Sales]/([Measures].[Sales],
Ancestor([Time].CurrentMember, [Time].[Years]))',
format_string='0.00%' select
{[Measures].[Sales],[Measures].[ShareToYear]}
ON COLUMNS,
Time.Members ON ROWS from [SteelWheelsSales]
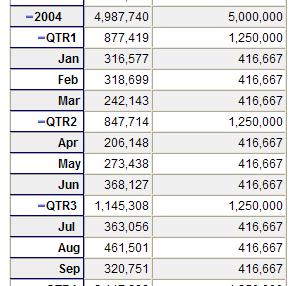
These calculated measures are fairly straightforward and not too different to the time series calculations we created in the previous article in this series. Let's now consider, though, the problem of allocating a value down a hierarchy: imagine that in 2003 the CEO of Steel Wheels had decided that the target sales for the year 2004 would be $5,000,000. On this basis, what should the target sales values for each Quarter and Month in 2004 be in that case? If we were to calculate this as an unweighted allocation so that each Quarter and Month would have the same value, then when we were looking at a Quarter show the value of $5,000,000 divided by the number of Quarters in 2004, and if we were looking at a Month show the value of $5,000,000 divided by the number of Months in 2004. We know how to find the set of descendants of a given member at a particular level with the DESCENDANTS function; combining this with the CURRENTMEMBER function and the LEVEL function, to return the level of the current member on Time, we can use the following expression to find the set of members on the same level as the current member on Time beneath the Year 2004:
Descendants([Time].[All Years].[2004],[Time].Currentmember.Level)
This expression returns a set of members, and we can find the number
of members in this set using the Count function so:
Count(
Descendants([Time].[All Years].[2004],[Time].Currentmember.Level)
)
This is of course the number we need to divide $5,000,000 by to find our allocated value, so (including the logic to make sure we only display values for the year 2004) our final query would be this:
with member [Measures].[2004 Sales Targets] as '
iif(Ancestor([Time].Currentmember, [Time].[Years]) is
[Time].[All Years].[2004], 5000000/
Count(
Descendants(
[Time].[All Years].[2004],
[Time].Currentmember.Level
) ) , 0) '
select
{[Measures].[Sales], [Measures].[2004 Sales Targets]}
ON COLUMNS, [Time].Members ON ROWS
from [SteelWheelsSales]
Thanks to Chris Webb for submitting this article!