MDX Calculations - Set Functions
January 15, 2007
Contributed by Chris Webb, Crossjoin Consulting
This technical article was generously contributed by Chris Webb, an OLAP guru and independent consultant (check him out at Crossjoin Consulting, or on his blog). Chris also has written a book on MDX called 'MDX Solutions', that you can get here once you are looking to go deep with Mondrian and MDX!
In the last two articles in this series we've focused on creating some common types of calculation in MDX. However, creating calculations isn't the only problem you'll face when creating business intelligence reports: you need to be able to define your queries appropriately too so you see the information you want. In this article we'll look at the ways you can manipulate sets in MDX in order to do this.
Resources Before You Get Started
To run the queries that Chris presents in this technical article, you will need JPivot, hooked up to the SteelWheelsSales sample cube. You can get both of these pre-configured and ready to use out of the box in the Pentaho Pre-configured Installation (PCI). Just navigate to the Steel Wheels Analysis Samples, and select the MDX Query button from the JPivot toolbar.
- Pentaho Pre-configured Installation (PCI) running locally, and the hypersonic database running locally with the SampleData database, version 1.2 or later.
Overview
First of all, though, what is a set? A set is an ordered list of either members or tuples (if you're not sure what a member or a tuple is it might be helpful to reread the first article in this series on 'Previous Period Growths') and is written in MDX as a comma-delimited list of uniquenames or tuples enclosed in curly brackets. Here's an example of a set of members:
{[Time].[All Years].[2003], [Time].[All Years].[2004], [Time].[All Years].[2005]}
And here's an example of a set of tuples:
{([Measures].[Sales],[Markets].[All Markets].[EMEA]),
([Measures].[Sales],[Markets].[All Markets].[APAC])}
MDX Queries By Example
When you're writing a SELECT statement in MDX you use sets to specify which data appears on which axis in your query. So, for example, we can take the first set above and put it on the columns axis in a query and take the second set and put it on rows, and the resulting SELECT statement would look like this:
select
{[Time].[All Years].[2003], [Time].[All Years].[2004], [Time].[All Years].[2005]}
on columns,
{([Measures].[Sales],[Markets].[All Markets].[EMEA]), ([Measures].[Sales],[Markets].[All Markets].[APAC])}
on rows
from [SteelWheelsSales]
Run this query and you'd see the following:
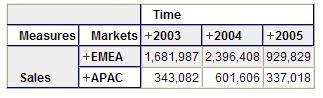
As noted above, a set is an ordered list and the members or tuples appear on the axis in the order they are specified in the set.
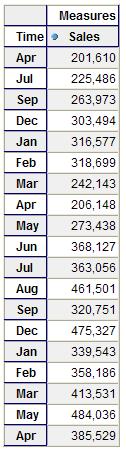
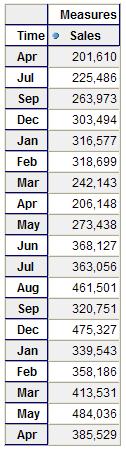
There are several MDX functions available which mean you don't always have to write out every member's unique name in your sets by hand. Probably the most common is the Members function which will return all the members on either a dimension or on a level in a dimension. Here's an example query which returns all the Months on the Time dimension on rows:
select
{[Measures].[Sales]}
on columns,
{[Time].[Months].Members}
on rows
from [SteelWheelsSales]
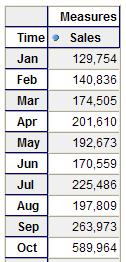
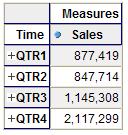
To use the Members function you simply give the unique name of the dimension or level (in the example above, the unique name of the Months level on Time is [Time]. [Months]) and add .Members onto the end of it. Other common functions include the Children and Descendants() functions which we came across earlier in this series, both of which return the set of members 'underneath' a given member in a dimension. Here's an example of the .Children function which shows all of the Quarters in the Year 2004:
select {[Measures].[Sales]}
ON COLUMNS,
{[Time].[All Years].[2004].Children}
ON ROWS
from \[SteelWheelsSales
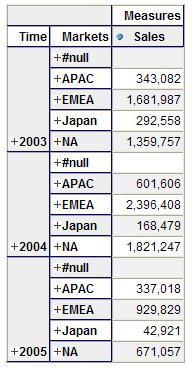
All of these functions return sets of members, but what about creating sets of tuples? This is where another very common function, Crossjoin(), comes in: it takes two sets of members from different dimensions, performs a cartesian product and returns a set of tuples containing every single possible combination of members from each set. So, logically,
Crossjoin ({a1, a2},{x1, x2})
will return the set
{(a1, x1), (a1, x2), (a2, x1), (a2, x2)}
. Here's an example which returns all possible combinations of Years and Markets on rows:
select
{[Measures].[Sales]} ON COLUMNS,
crossjoin(
[Time].[Years].Members,
[Markets].[All Markets].Children)
ON ROWS
from [SteelWheelsSales]
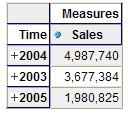
Now we've got our sets, let's do something useful with them. For instance we might want to sort the items in the set in a particular order, and to do that we need to use the Order() function. Order() takes three parameters: the set you wish to sort, the MDX expression you wish to use to sort by, and whether you want to sort in ascending or descending order. Here's an example that sorts all of our Years by Sales:
select {[Measures].[Sales]}
ON COLUMNS,order(
[Time].[Years].Members,[Measures].[Sales],bdesc)
ON ROWS
from [SteelWheelsSales]
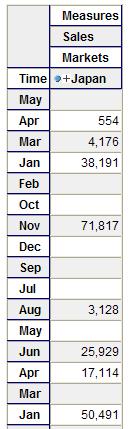
The second parameter, the MDX expression you wish to order by, can either return a numeric value or a string value. In the example above we used the Sales measure but we could equally have used a tuple, and it's important to remember that this expression is independent of anything we are displaying on columns. So, for instance the following query shows Years ordered in the same way as in the previous query even though the ordering does not reflect the values actually displayed in the grid:
select
{([Measures].[Sales], [Markets].[All Markets].[Japan])}
ON COLUMNS,
Order([Time].[Years].Members, [Measures].[Sales], BDESC)
ON ROWS
from [SteelWheelsSales]
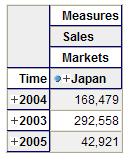
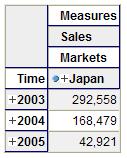
This can be pretty confusing for people new to MDX ' we are sorting by Sales at the [All Markets] level but displaying Sales for Japan. If we wanted to sort by the values we're seeing in this query, we'd need to explicitly state that we wanted to sort by Sales for Japan by using a tuple in the second parameter:
select {([Measures].[Sales], [Markets].[All Markets].[Japan])}
ON COLUMNS,
Order([Time].[Years].Members, ([Measures].[Sales],
[Markets].[All Markets].[Japan]), BDESC)
ON ROWS
from [SteelWheelsSales]
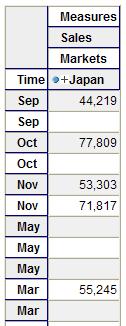
There's one last thing to notice about the Order() function, and that's the 'b' in front of the 'desc' in the last parameter. This 'b' stands for 'break the hierarchy': without it Order will first sort the member in the set you pass in into hierarchical order and then sort by the criteria you specify. You can see what this does by running the two queries which show all Months sorted by name ' the first breaks the hierarchy, so that you see all the Septembers, then all the Octobers, then all the Novembers and so on, while the second retains the hierarchy so you see all the Months for 2003 sorted by name, then all the Months for 2004 sorted by name and all the Months for 2005 sorted by name.
select
{([Measures].[Sales], [Markets].[All Markets].[Japan])}
ON COLUMNS,
Order([Time].[Months].Members, [Time].CurrentMember.Name, BDESC)
ON ROWS
from [SteelWheelsSales]select {([Measures].[Sales], [Markets].[All Markets].[Japan])}
ON COLUMNS,
Order([Time].[Months].Members, [Time].CurrentMember.Name, DESC)
ON ROWS
from [SteelWheelsSales]
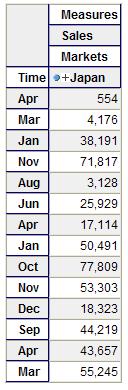
Another thing we might want to do with our set is filter it somehow. Looking the query we've just run we can see that there are several rows with no values and we might want to remove those rows from the resultset. The easiest way to do is to add NON EMPTY before the beginning of our row axis definition, as follows:
select
{([Measures].[Sales], [Markets].[All Markets].[ Japan ])}
ON COLUMNS,
NON EMPTY Order([Time].[Months].Members, [Time].CurrentMember.Name, DESC)
ON ROWS
from [SteelWheelsSales]
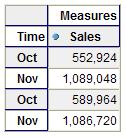
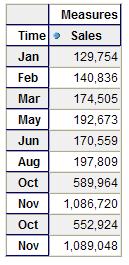
NON EMPTY has removed all rows where every value on that row is a null, and if we added it to the columns axis it would do the same there. To implement more demanding filter criteria, though, we need to use the Filter() function. It takes two parameters: the set you wish to filter and an MDX expression which returns a Boolean value which will be evaluated for every item in the set. Here's an example which only returns Months where Sales is greater than 500000:
select
{[Measures].[Sales]}
ON COLUMNS,
Filter( Order([Time].[Months].Members, [Time].CurrentMember.Name, DESC) ,
([Measures].[Sales] > 500000.0))
ON ROWS
from [SteelWheelsSales]
This also illustrates the fact that you can nest functions like Filter() and Order() which take a set as one of their parameters and return a set.
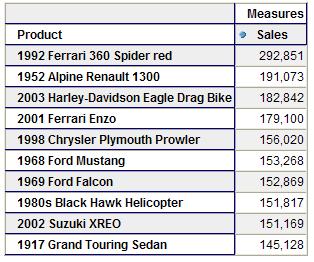
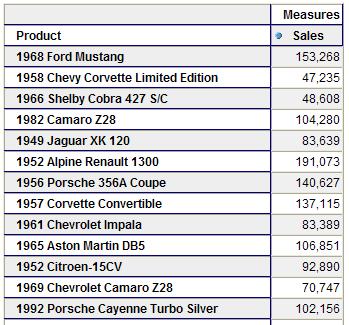
Another common type of filter is the 'top n', for example where you want to return your top ten best-selling products. MDX provides the Topcount() function to allow you to do this (there is also a Bottomcount() function which finds the 'bottom n', a Toppercent() function which finds the 'top n%' and a Bottompercent() function) and it takes three parameters: the set you wish to filter, the number of items you want to return, and the MDX expression to filter with. Here's an example:
select {[Measures].[Sales]}
ON COLUMNS,
TopCount([Product].[Product].Members, 10.0, [Measures].[Sales])
ON ROWS
from [SteelWheelsSales]
For people coming to MDX who have more than a passing knowledge of SQL, it's easy to get confused by the fact that you need to filter using functions in this way and not using the WHERE clause. MDX also has a WHERE clause but it never directly filters what you can see on the rows and columns of your query ' it acts more as a third axis, one member thick, which slices the resultset. Consider the following query:
select
{[Measures].[Sales]}
ON COLUMNS,
[Product].[Product].Members
ON ROWS
from [SteelWheelsSales]
It has no WHERE clause and it doesn't mention the Time dimension at all, but that doesn't mean we're not slicing by something on Time ' we are, we're seeing values for the All member on Time. When we introduce a WHERE clause we can explicitly state which member on the Time dimension we want to see values for, for example the Year 2004:
select {[Measures].[Sales]}
ON COLUMNS,
[Product].[Product].Members
ON ROWS
from [SteelWheelsSales]
where([Time].[All Years].[2004])
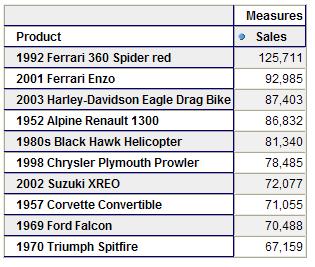
Notice that while the Products that appear on the rows haven't changed, the values for Sales have ' we're now seeing the Sales for the Year 2004 alone. So a WHERE clause can't directly affect which members appear on an axis, but it can do so indirectly if you're applying some kind of filter to that axis. If we go back to our Topcount() example and add a WHERE clause specifying that we see values for 2004 alone, we'll only see the top 10 products for 2004:
select
{[Measures].[Sales]}
ON COLUMNS,
TopCount([Product].[Product].Members, 10.0, [Measures].[Sales])
ON ROWS
from [SteelWheelsSales]
where([Time].[All Years].[2004])
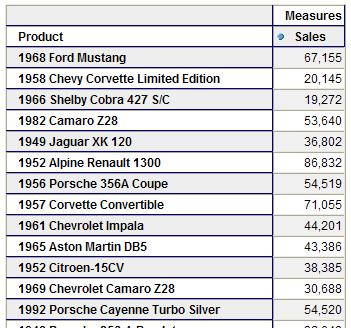
We can now see that the second-highest ranking product is the 2001 Ferrari Enzo and not the 1952 Alpine Renault ' the Topcount function has taken into account the WHERE clause in its filter. In fact all the filter functions we've looked at in this article so far will do this ' but why do they take the WHERE clause into account when they don't take what's on the opposing axis into account, as we saw earlier with the Order function sorting by something other than what was on columns? Simply because they can: the WHERE clause is an axis one member thick so logically there's no problem about which value to use for the filtering ' this is only one value to use, the value that's displayed. On the other axes there is potentially more than value to take into account (for example on the rows axis there could be more than one column to choose from) so MDX instead ignores these axes and makes you explicitly state what you want to filter by.
As with SQL there is the concept of finding the union of two sets and it's also possible to subtract one set from another and find the intersection between two sets. The following query uses the Union() function to return all Months which have Sales greater than 500000 plus those which have Sales less than 200000:
select {[Measures].[Sales]}
ON COLUMNS,
union( filter( [Time].[Months].Members, ([Measures].[Sales],
[Time].Currentmember)<200000 ) ,
filter( [Time].[Months].Members, ([Measures].[Sales],
[Time].Currentmember)>500000 ) )
ON ROWS
from [SteelWheelsSales]
The Except() function takes the removes all members found in one set from another. So, for example, the following query shows all Months with Sales greater than 200000 except those which have Sales greater than 500000:
select
{[Measures].[Sales]}
ON COLUMNS,
except(
filter( [Time].[Months].Members, ([Measures].[Sales],
[Time].Currentmember)>200000 ) ,
filter( [Time].[Months].Members, ([Measures].[Sales],
[Time].Currentmember)>500000 ) )
ON ROWS
from [SteelWheelsSales]
The Intersect() function returns only those members present in both sets passed into it, so for example the following query returns the Months which have Sales greater than 200000 and Sales less than 500000:
select {[Measures].[Sales]}
ON COLUMNS,
intersect(
filter( [Time].[Months].Members, ([Measures].[Sales],
[Time].Currentmember)>200000 ) ,
filter( [Time].[Months].Members, ([Measures].[Sales],
[Time].Currentmember)<500000 ) )
ON ROWS
from [SteelWheelsSales]
Lastly, it's possible to iterate over every member of a set and perform a set operation at each iteration. Why would you need to do this? Let's say that you've found our top 3 selling Products and you want to find the top 5 Months for each of these Products. You might think that the following query would do the trick:
select
{[Measures].[Sales]}
ON COLUMNS,
crossjoin( TopCount([Product].[Product].Members, 3, [Measures].[Sales]) ,
TopCount([Time].[Months].Members, 5, [Measures].[Sales]) )
ON ROWS
from [SteelWheelsSales]
However, the fact that the top 5 Months for each Product are the same might make you suspicious and in fact further investigation will show that this query does not return what we wanted. It actually returns the Crossjoin of the top 3 Products for all Months and the top 5 Months for all Products, although the Sales values for each Product/Month tuple are correct. What we need to do is use the Generate() function to iterate through the set of Products and for each Product return the top 5 Months for that Product as follows:
select {[Measures].[Sales]}
ON COLUMNS,
Generate( TopCount([Product].[Product].Members, 3, [Measures].[Sales]) ,
Crossjoin(
{[Product].Currentmember}
,
TopCount([Time].[Months].Members, 5, [Measures].[Sales]) ) )
ON ROWS
from [SteelWheelsSales]
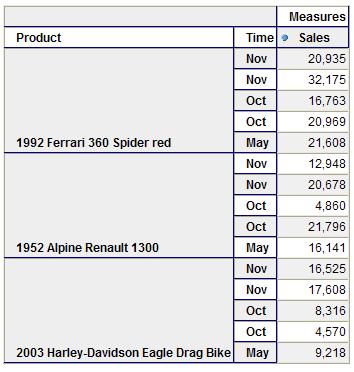
In this case Generate is being passed the set of the top 3 Products as its first parameter, and then for each of these three Products it Crossjoins the Currentmember on Product (the current Product in the iteration) with the top 5 Months which produces the result we're looking for.
Thanks to Chris Webb for submitting this article!