Documentation
NOTE: This information is valid as of Agile BI milestone 3 (M3).
- Building Business Intelligence Solutions Using Agile BI
- Prototype With Data Integration
- Use the Model and Visualization Perspectives to Rapidly Analyze Schema Prototypes
Introduction to Agile BI
Pentaho Agile Business Intelligence (Agile BI) is a new, iterative design approach to BI development. The Agile BI project provides a set of tools that allows effective collaboration on BI project prototyping by members of an agile development team. That team may be composed of ETL designers, business analysts, database administrators, IT developers, consultants, savvy technical users and more.
Agile BI provides an integrated solution that enables you to go seamlessly from ETL to modeling to reporting and data exploration. Competitor solutions require these process steps to occur separately through the use of individual tools.
Methodology
The suggested workflow, starting with production data and ending with a tested Mondrian schema that is ready for end-user reporting and analysis is:
Build data warehouse -> Rearrange the data using ETL tools -> Model the data using modeling tools -> Report and/or analyze data using reporting/analysis tools
Using Pentaho Agile BI, the process above is integrated into one tool. Leveraging the power of Pentaho Data Integration (PDI), an ETL designer is able to massage data as needed, and, based on input from a business analyst, is able to go directly into modeling the data, visualizing the data, and finally to providing the data to users for self-serve reporting and analysis. Because the ETL, modeling, visualizing, and reporting tools are integrated, it is easy for ETL designers and business analysts to work iteratively and to make needed changes to the data quickly and effectively. This allows BI projects to run more smoothly and cost-effectively. Agile BI also allows the ETL designer to add modeling to his skill set, thus reducing time allotted for proof-of-concept and prototype iterations.
While building a data warehouse, the ETL designer can immediately create a model based on data he has already built. The ETL designer can then explore (visualize) the data. For example, in cooperation with a BI analyst, the ETL designer may determine that certain dimensions are not applicable or that more hierarchies are required. The visualization step also allows data quality issues to be identified and corrected. At this point the ETL designer can return to PDI and build additional hierarchies, model, then visualize the data again. Adjustments can be made iteratively until the data is exactly what the BI analyst and end users want to see.
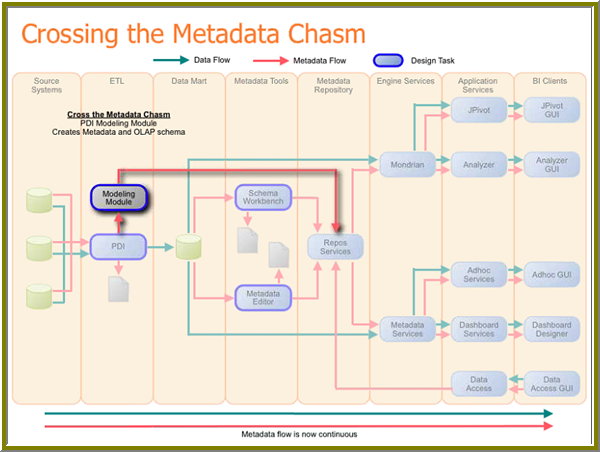
Architecture
Agile BI is delivered as a plugin to Pentaho Data Integration. This adds a Modeling Module that generates the metadata necessary for Mondrian (Pentaho Analysis) and the metadata services.
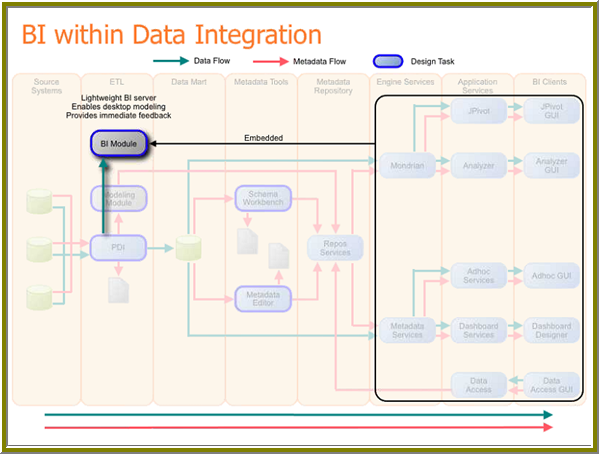
The BI Model embedded into Pentaho Data Integration is actually a trimmed-down BI Server that allows the ETL designer, database administrator, or IT developer to perform data visualizations on the fly (locally, on the desktop or laptop) without having to publish the metadata to a real BI Server; it also allows for quick end-to-end iterations without requiring a full BI Server installation.
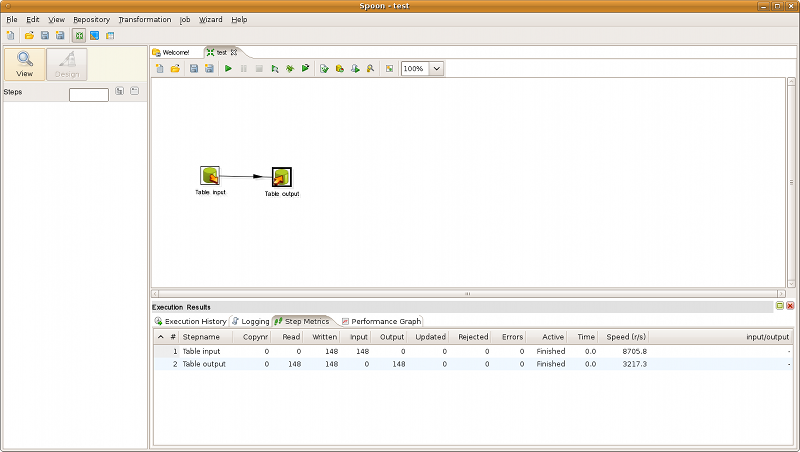
UI Perspectives
The Agile BI plugin modifies the Spoon user interface to include two new perspectives aside from the standard Jobs/Transformations: Agile BI (known as the Modeler) and Visualization.
The standard Jobs/Transformations perspective remains more or less the same:
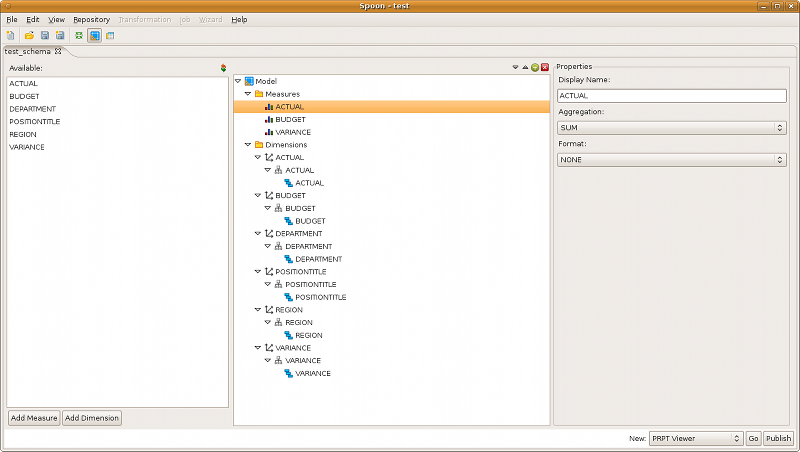
Agile BI (Modeler) Perspective
The Modeler is a simple graphical interface that enables you to fine-tune your ROLAP schema.
To get to the Modeler screen, right-click your table output step and select Model from the context menu, or change to the Agile BI perspective using the toolbar icon or the entry in the Perspectives section of the View menu. If this is your first post-transformation attempt at creating a Mondrian schema, you'll be asked if you'd like to automatically populate the new schema with default dimensions and members. In most instances you should choose Yes.
To add members: Select the Measures or Dimensions group, then click the green + icon above the center pane, or the Add Dimension or Add Measure button in the lower left corner of the Modeler window.
To remove members: Select the member you want to remove, then red X button above the center panel.
To see what the schema looks like in Pentaho Analyzer: First, save your schema. Second, click Go in the lower right corner of the screen.
To publish the schema to your BI Server: First, save your schema. Second, click Publish in the lower right corner of the Modeler window. When prompted, enter your BI Server publish credentials. DOES NOT CURRENTLY WORK
To see what the schema looks like in a report: First, save your schema. Second, select PRPT Viewer in the drop-down box in the lower right corner of the Modeler window. The Report Design Wizard will launch and walk you through creating a simple report with your schema.
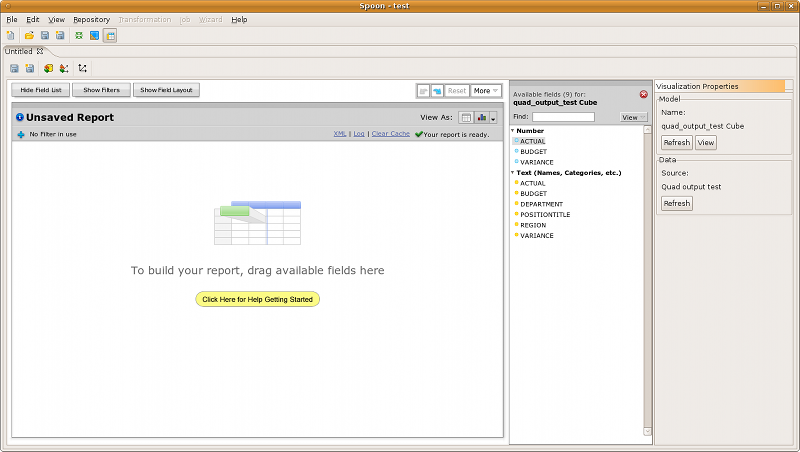
Visualization
To view your new ROLAP schema in Pentaho Analyzer, first you must create a basic schema with the Modeler. Once you have a schema worthy of testing, you can access Pentaho Analyzer as explained in the previous section. If you already have a ROLAP schema and are coming from the Jobs/Transformations perspective, you can skip directly to Analyzer by right-clicking your table output step, then selecting Visualize from the context menu, or changing to the Visualize perspective using the toolbar icon or the entry in the Perspectives section of the View menu.
This version of Pentaho Analyzer runs inside of Spoon, and provides all of the major Analyzer functionality. Simply drag and drop measures and dimensions from the lists on the right to the viewer on the left, and rearrange them accordingly.
NOTE: As of milestone 3 (M3), Spoon does not properly save or publish Analyzer reports. Do not attempt to save a report or publish a schema to the BI Server from this version of Analyzer. Instead, save your schema, open it with Schema Workbench, and publish it from there.