Using the Univariate Statistics Plugin
Contents
1 Introduction
The univariate statistics plugin is a tool that allows simple, univariate statistics to be computed from incoming data in a Kettle transform. The plugin can compute statistics for as many input fields as you want. The available statistics are: N, minimum, maximum, mean, sample standard deviation, median and arbitrary percentiles (computed using a simple mid-point method or interpolation).
2 Getting Started
In order to use the univariate scoring plugin, it must first be installed correctly in Kettle --- unpack the plugin archive and copy all files in the UnivariateScoringDeploy directory to a sub-directory in the plugins/steps directory of your Kettle installation. Now start Spoon. Confirm that the plugin has been installed and correctly recognized by Kettle by expanding the "Transforms" list under "Core Objects" in Spoon. You should see Univariate statistics listed in bold near the bottom of the list. 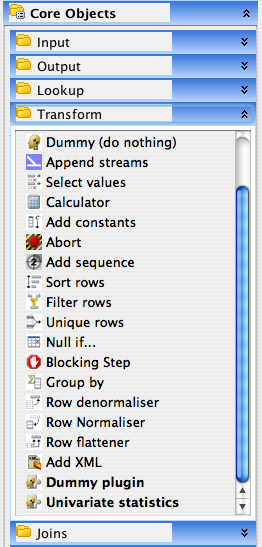
3 Configuring the Univariate Statistics Step
Assuming that you have the univariate statistics step connected to a previous step, double click on its icon to open the configuration dialog.
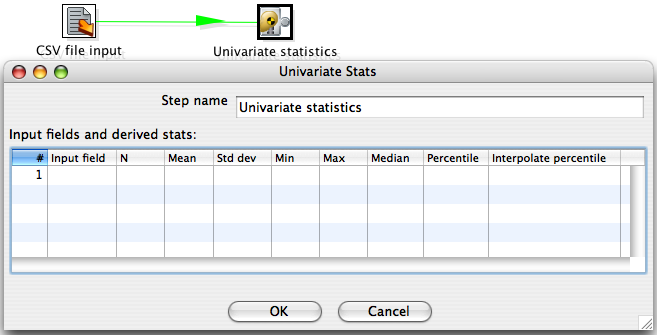
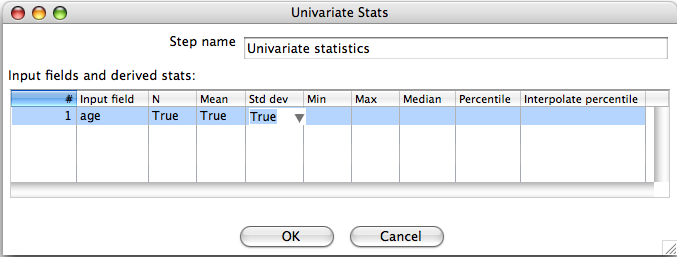
The dialog shows a text field that can be used to name the step and an area for selecting input fields to compute statistics for. Each row in the "Input fields and derived stats" area specifies one input field and which statistics will be computed for it.
3.1 Select An Input Field
Clicking on the "Input field" column of row one will allow you to choose an input field to compute statistics for. Only input fields that are numeric will be shown in the list. 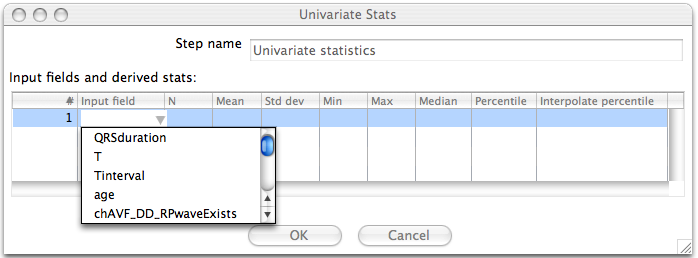
3.2 Choose Which Statistics will be Computed
Each of the columns, aside from "Input field" and "Interpolate percentile" allow you choose whether the associated statistic will be computed for the input field selected in that row of the table. Empty cells, by default, mean that the corresponding statistic will not be computed. Clicking on the "N", "Mean", "Std dv", "Min", "Max" or "Median" column allows you to enable the corresponding statistic. For all statistics, with the exception of percentile, this involves choosing "true" or "false" from a list. For the percentile statistic, you must enter a value between 0 and 100 (note that entering 50 results in the same computation as enabling the "Median" statistic).
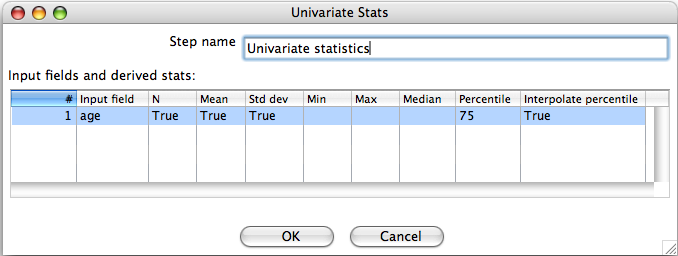
3.3 Computing Percentiles
Any percentile for an incoming field can be computed by entering a value between 0 and 100 in the "Percentile" column. If the "Interpolate percentile" field is blank or has the value "false", then a simple method for computing percentiles is used. This method will either return a value that actually exists in the incoming data or the mid-point between two adjacent values (after the data has been sorted). Selecting "true" for the "Interpolate percentile" field will enable the use of a more sophisticated percentile computation that smoothly interpolates between adjacent values in the data. Full details of how these computations are achieved is detailed in the online Engineering Statistics Handbook
(http://www.itl.nist.gov/div898/handbook/prc/section2/prc252.htm). The simple method is described in the second to last paragraph on this web page and the sophisticated method is the main topic of the article.
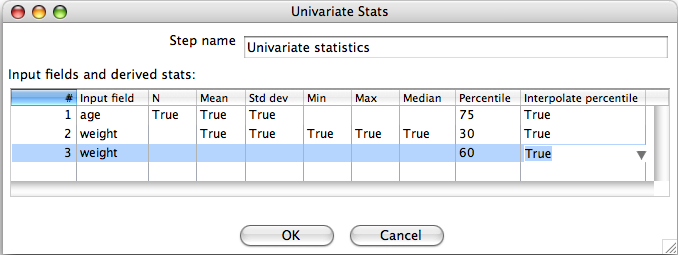
3.4 Computing Statistics for More Than One Input Field
Statistics for further input fields can be configured by clicking on additional rows in the table. Similarly, if more than one percentile is required for the same input field then additional rows in the table can be used to achieve this.
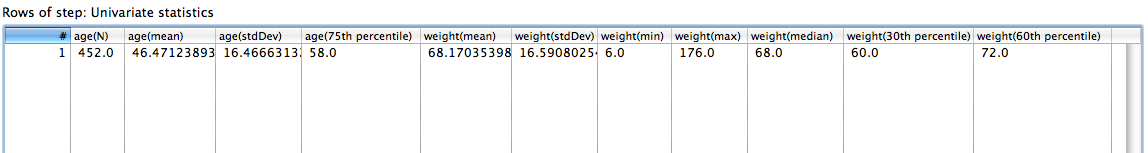
4 Output Produced by the Univariate Statistics Step
The univariate statistics step produces a singe row of output data. Each field in the output corresponds to a single statistic computed for a particular input field. The names of the output fields make it clear as to which statistic has been computed and for which input field it is for.